Boonton Power Sensor User Manual
Page 7
2
Power Sensor Manual
This non-square-law region may be "shaped" with meter corrections, but only for one
defined waveform, such as a CW signal. By incorporating "shaping", also referred to as
"Linearity Calibration", Boonton offers a dynamic range from 0.1 nW (-70 dBm) to 100
mW (+20 dB) with a single sensor module. For CW measurements, the entire 90 dB
range can be used, however, when dealing with non-sinusoidal and high-harmonic
content signals, the Diode Sensor should be operated only within its square-law region
(10 µW and below).
Although thermal sensors provide a true indication of RMS power for modulated (non-
CW) signals, they are of limited use for characterizing the short-term or instantaneous
RF power due to their rather slow response speed. For accurate power measurements of
short pulses or digitally modulated carriers, Boonton has developed a line of wideband
diode sensors called Peak Power Sensors. These sensors are specially designed for
applications where the instantaneous power of an RF signal must be measured with
high accuracy. They are for use with the Boonton Model 4400 peak Power Meter and
the Model 4500 Digital Sampling Power Analyzer. Because the bandwidth of Peak
Power Sensors is higher than most modulated signals (30 MHz or more for some sensor
models), they accurately respond to the instantaneous power envelope of the RF signal,
and the output of the sensor may be fully linearized for any type of signal, whether CW
or modulated. Boonton Peak Power Sensors contain built-in nonvolatile memory that
stores sensor information and frequency correction factors. The linearity correction
factors are automatically generated by the instrument's built-in programmable calibrator.
With the high sensor bandwidth, and frequency and linearity correction applied
continuously by the instrument, it is possible to make many types of measurements on
an RF signal; average (CW) power, peak power, dynamic range, pulse timing, waveform
viewing, and calculation of statistical power distribution functions.
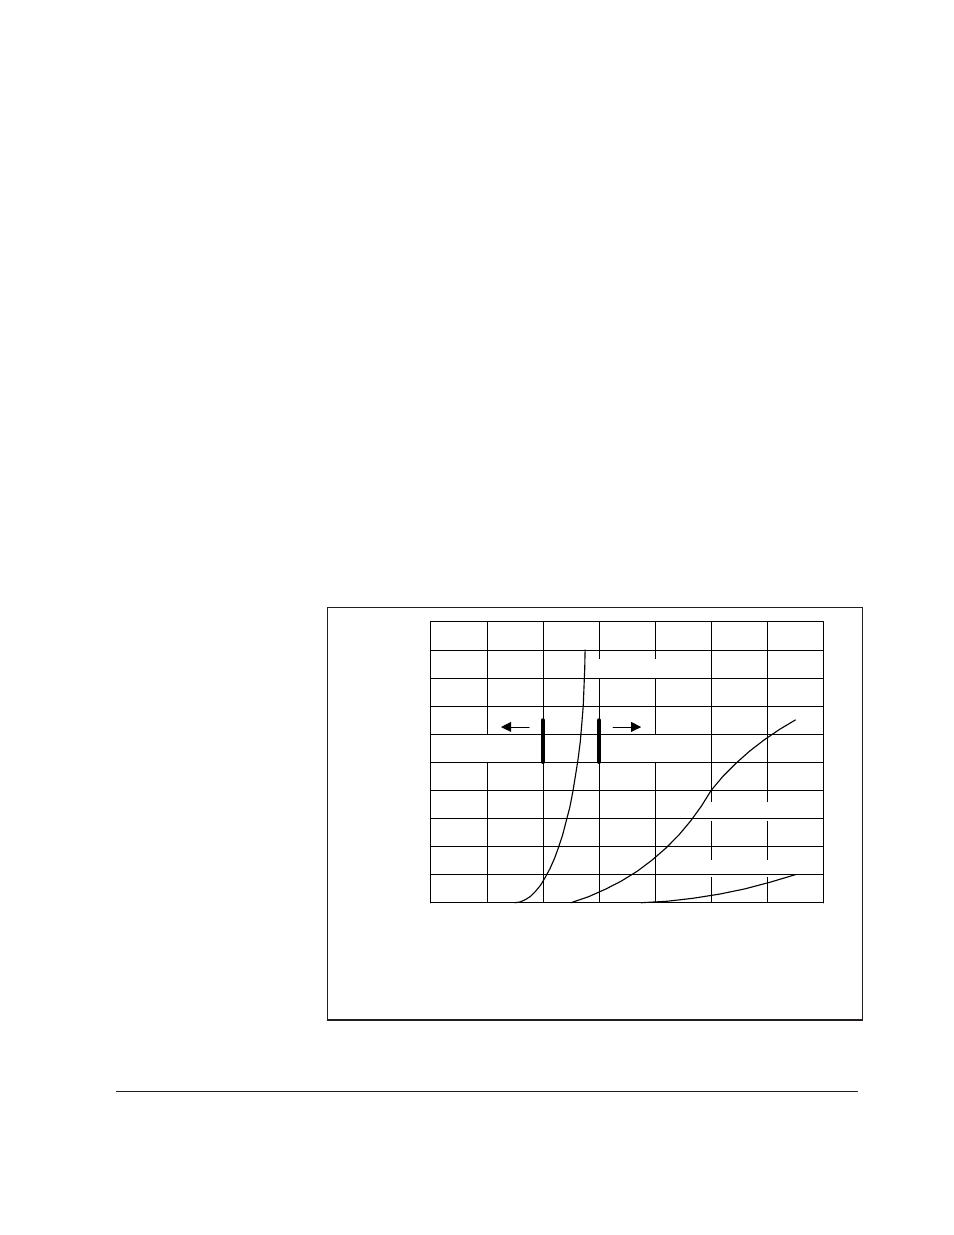
Figure 1-1. Error Due to AM Modulation (Diode Sensor)
Note:
The error shown is the error above and beyond the
normal power increase that results from modulation.
E
rror (dB
)
-30
-20
-10
0
+10
+20
0.1
0.2
0.3
0.4
0.5
0.6
0.7
0.8
0.9
10% AM Modulation
3% AM Modulation
100% AM Modulation
Peak Detecting
Region
Square-Law
Region
Carrier Level
(dBm)