Boonton Power Sensor User Manual
Page 18
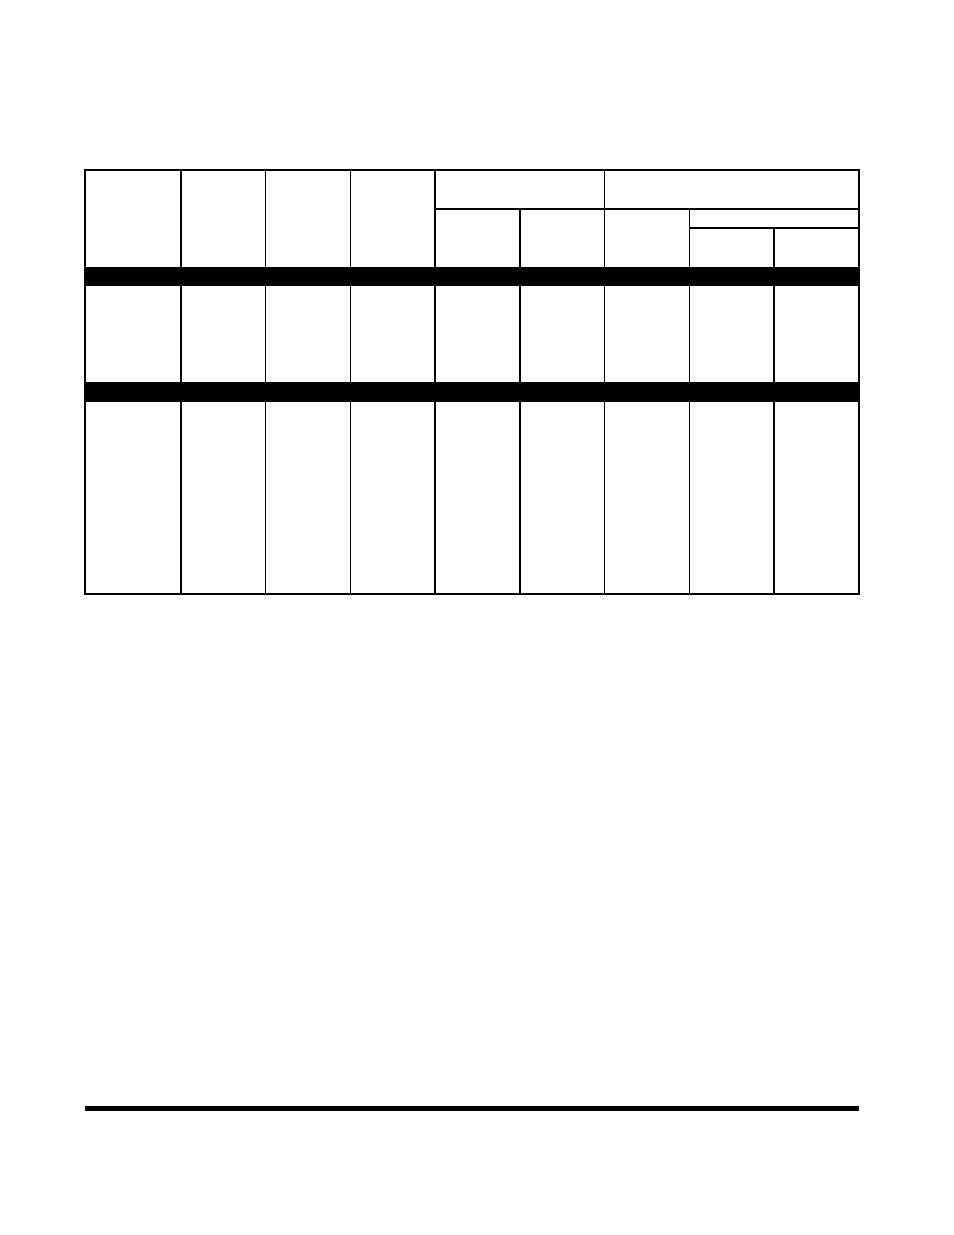
Table 2-3. Legacy Diode CW Sensor Characteristics (con't.)
Model
Frequency
Range
Dynamic
Range
Overload
Rating
Maximum SWR
Drift and Noise
@ 0 dBm
Lowest Range
Impedance
(1)
Peak Power
Drift (typ.)
Noise
RF Connector
CW Power
Frequency
SWR
1 Hour
RMS
2 σ
(dBm)
(GHz)
(2)
(typical)
DUAL DIODE SENSORS
51078
100 kHz
-20 to +37
100 W for 1µs
to 4
1.15
150 nW
65 nW
130 nW
50
Ω
to 18 GHz
(3) (8)
7 W
to 12
1.25
(6)
N(M)
to 18
1.40
DC COUPLED SINGLE DIODE SENSORS
51081
1 MHz
-30 to +10
200 mW
to 0.5
1.04
200 pW
200 pW
400 pW
50
Ω
to 40 GHz
(4)
to 40
2.00
(7)
k(M)
51082
40 GHz
-30 to +10
200 mW
50 MHz (ref.)
1.04
200 pW
200 pW
400 pW
50
Ω
to 50 GHz
(4)
40 to 50
2.20
(7)
V(M)
NOTES: 1) Applies to all Boonton Power Meters unless otherwise indicated with the exception of Model 4200 and 4200A.
The lower limit of the Dynamic Range for Models 4200 and 4200A does not extend below -60 dBm and the
upper limit is degraded by 10 dB with the exception of sensor Model 51033 where the Dynamic range is -40 to +30 dBm.
2) After two-hour warm-up: High frequency power linearity uncertainty: (worst case) (0.005 x f) dB per dB,
where f is in GHz above +4 dBm for sensors 51011, 51012, 51013 ; above +14 dBm for sensor 51015;
above +24 dBm for sensor 51033
3) Power Linearity Uncertainty at 50 MHz:
<10 dBm: 1% for 51011, 51012, 51013, 51015, and 51033 sensors.
10 to 20 dBm: 1% for 51015 and 51033 sensors; 3% for 51011, 51012 and 51013 sensors.
20 to 33 dBm: 3% for 51015 and 51033 sensors.
30 to 37 dBm: 3% for 51078 sensor.
4) Power Linearity Uncertainty 30/50 MHz. -30 to -10 dBm: 6% (0.27 dB), -10 to +10 dBm: 4% (0.18 dB)
5) Temperature influence: 0.02 dB/ºC ( 0 to 25ºC), 0.01 dB/ºC (25 to 55ºC)
6) Temperature influence: 0.03 dB/ºC (0 to 55ºC)
7) Temperature influence: -30 to -10 dBm: 0.03 dB/ºC, -10 to +10 dBm: 0.01 dB/ºC (0 to 55ºC)
8) Not available on 4200 series.
Power Sensor Manual
13