Boonton Power Sensor User Manual
Page 33
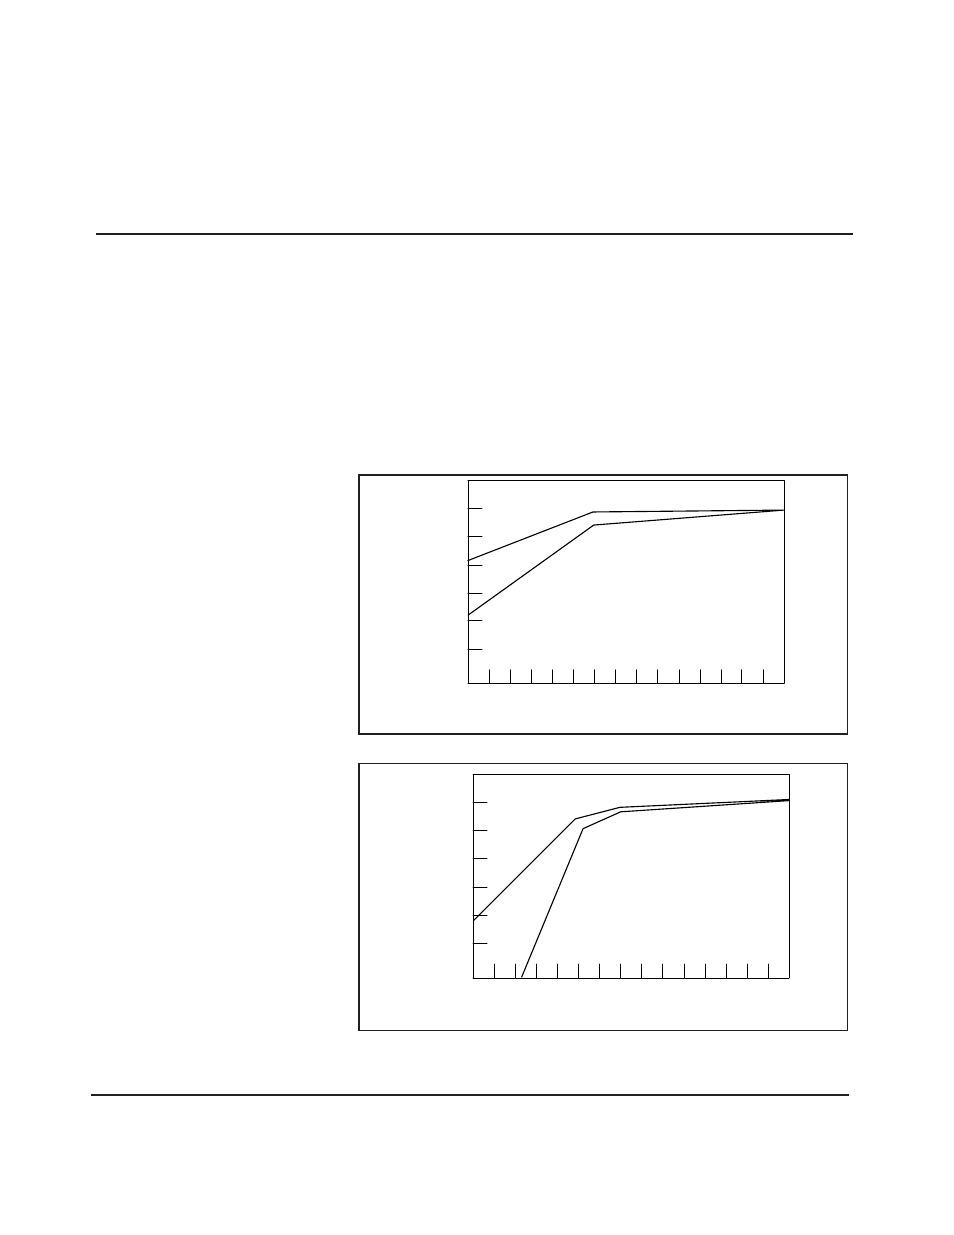
Low Frequency Response and
Standing-Wave-Ratio (SWR) Data
Figure 4-2. Model 51072 Low Frequency Response
The typical performance data that follows is not guaranteed, however, it represents a
large number of production units processed. Therefore, it is a good guideline for user
expectations. The worst case specifications are quite conservative in accordance with
Boonton's general policy.
Detailed SWR data is supplied with each sensor unit shipped against a customer order
to give the user specific information required to properly evaluate errors in a particular
application. Please consult the factory for optional units with more stringent
specifications.
The typical low frequency response for three sensor models are shown in Figures 4-1
through 4-3. Figures 4-4 through 4-10 represent SWR Data.
26 Power Sensor Manual
Figure 4-1. Model 51071 Low Frequency Response
1
50
Frequency (MHz)
Response (dB
)
-1
-2
-4
-5
-3
0
0 dBm
-40 dBm
10
1
50
Frequency (MHz)
Response (dB
)
-1
-2
-4
-5
-3
0
0 dBm
-40 dBm
10
4
28