Boonton Power Sensor User Manual
Page 51
Step 9: The Sensor Calfactor Uncertainty needs to be interpolated from the uncertainty
values given in Table 3-2 (Peak Power Sensor Calibration Factor Uncertainty). At 1 GHz, the
sensor’s calfactor uncertainty is 1.7 %, and at 0.5 GHz it is 1.6 %. Note, however, that
we are performing our AutoCal at a frequency of 1 GHz, which is very close to the
measurement frequency. This means that the calfactor uncertainty cancels to zero at 1 GHz.
We’ll use linear interpolation between 0.5 GHz and 1 GHz to estimate a value. 900 MHz
is only 20% (one fifth) of the way from 1GHz down to 500MHz, so the uncertainty figure at
0.5 GHz can be scaled by one fifth.
U
CalFactor
= [ ( F - F
1
) * (( CF
2
- CF
1
) / ( F
2
- F
1
)) ] + CF
1
where;
F = 0.9
F
1
= 0.5
CF
1
= 1.6
F
2
= 1.0
CF
2
= 0.0
= [ ( 00.9 - 00.5 ) * (( 0.0 - 1.6 ) / ( 1.0 - 0.5 )) ] + 1.6
= [ ( 0.4 ) * (( -1.6 ) / ( 0.5 )) ] + 1.6
= [ ( 0.4 ) * ( -1.6 ) ] + 1.6
= 0.32 %
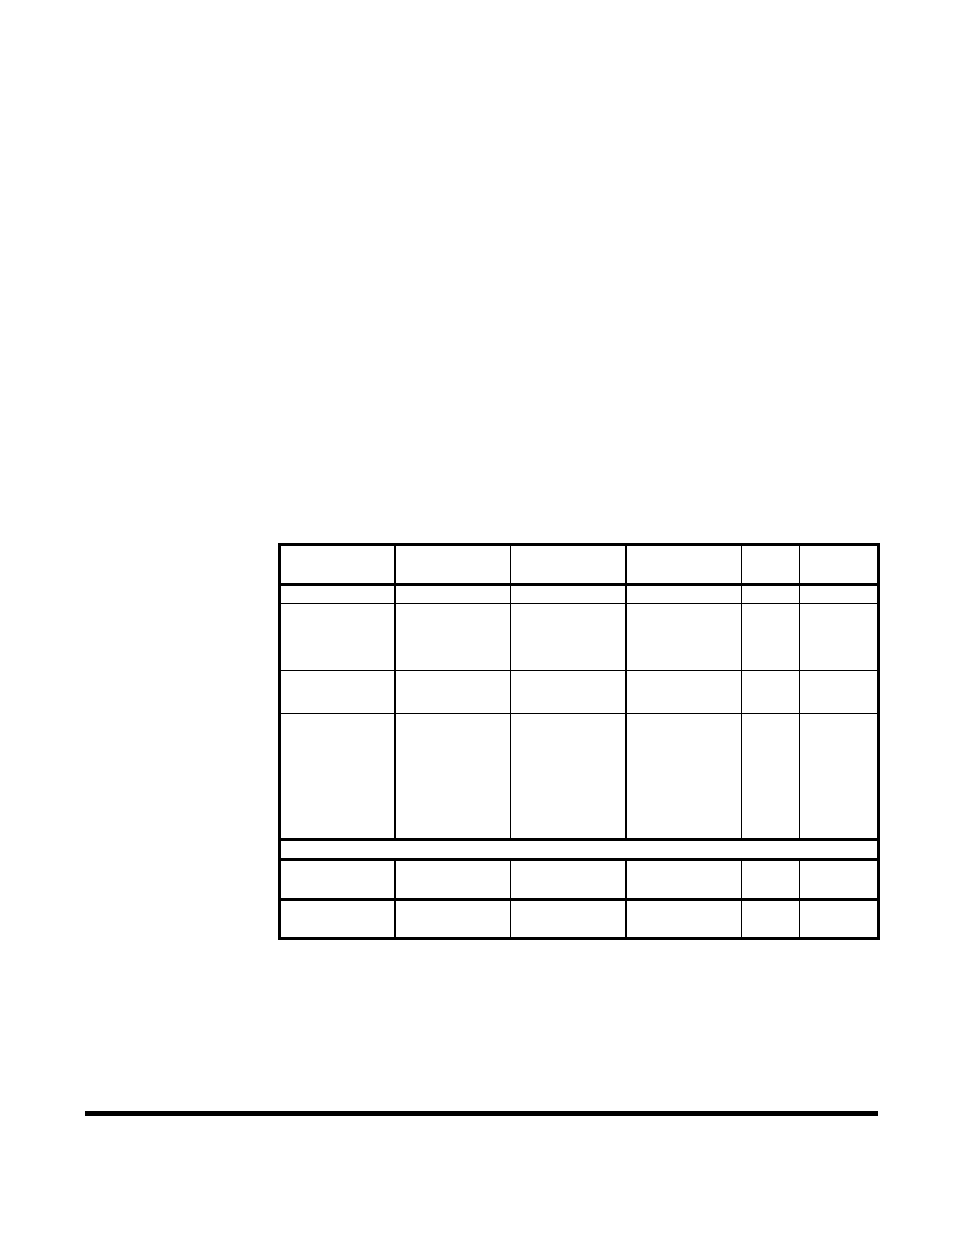
Step 10: Now that each of the individual uncertainty terms has been determined, we can
create an uncertainty budget and calculate the combined standard uncertainty (Uc) .
Source of
Symbol
Value
Probabilty
Divisor
Ustd
Uncertainty
(+/- %)
Distribution
(+/- %)
Instrument
I
0.2
normal
2
0.10
Calibrator
Level
R
3.11
rectangular
( 3 )
0.5
1.80
Mismatch
M
C
1.27
U-shaped
( 2 )
0.5
0.90
Source
Mismatch
M
S
0.80
U-shaped
( 2 )
0.5
0.57
Sensor
Shaping
S 2.00
rectangular
( 3 )
0.5
1.15
Temp. Drift
T
1.69
rectangular
( 3 )
0.5
0.98
Noise
N
0.03
normal
2
0.02
Cal Factor
K
0.32
normal
2
0.16
Combined Standard
Uc
normal
2.58
Uncertainty
Expanded
U
normal
5.17
Uncertainty
(k=2)
From this example, different uncertainty terms dominate. Since the measurement is close to
the calibration frequency, and matching is rather good, the shaping and level errors are the
largest. The Expanded Uncertainty of 5.17 % translates to an uncertainty of about 0.22 dB
in the reading.
44
Power Sensor Manual
46