Displaying the memory graph – HP Insight Control User Manual
Page 72

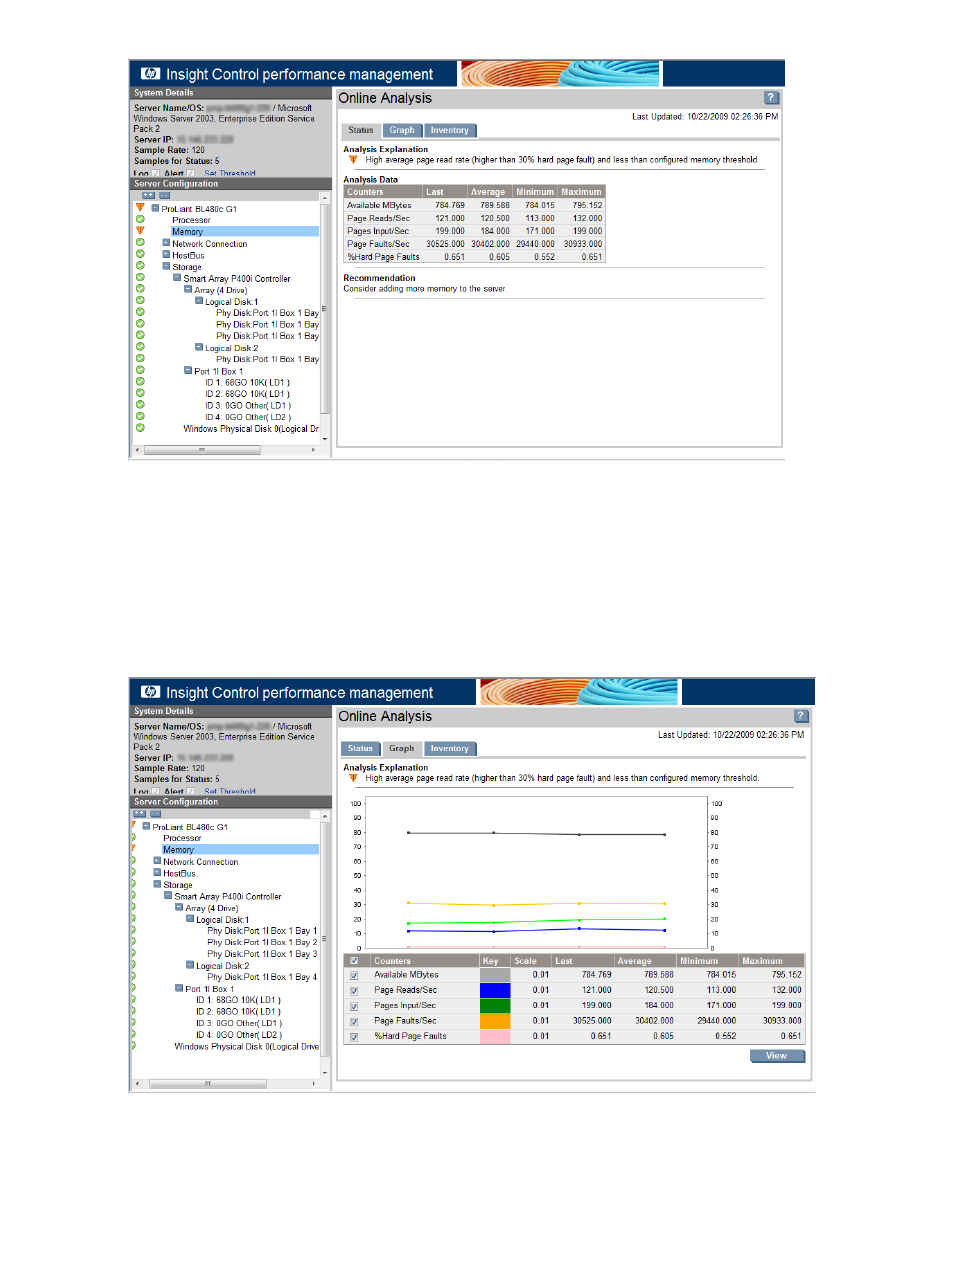
The Analysis Explanation details an above-average page-read rate (higher than 30% of the hard page fault),
and less than configured memory threshold. The analysis recommends more physical memory to handle the
load. Many recommendations suggest adding hardware.
In this example, the situation might have occurred because a new batch job was assigned to run on the
server at night. The remainder of this scenario examines other performance information available to assist
in troubleshooting to determine if immediate action is required to resolve the performance bottleneck.
Displaying the memory graph
To show a graphical display of memory counters in the Results pane, click the Graph tab.
This graph displays the number of samples as selected in Monitoring Administration Page. The duration
of the graph would be for a period same as sample rate (default 120) multiplied by Number of Samples.
72
Bottleneck scenarios
- LSGX203M (39 pages)
- 288048 (30 pages)
- A3312AZ (149 pages)
- R5500 (61 pages)
- R1500 (49 pages)
- PROCURVE 2610 (112 pages)
- COMBI 2180206H (36 pages)
- A1354A (120 pages)
- Power Management System (32 pages)
- Power Management (27 pages)
- C4788x (37 pages)
- 6621A (115 pages)
- 6631B (75 pages)
- Anab EQ Series (131 pages)
- T2200 (55 pages)
- T1500 (48 pages)
- Aikido Stereo 9-Pin PCB (13 pages)
- GRACO OR PRO TI1681A (70 pages)
- GMAX 5900 (28 pages)
- Teco MA7200 Plus (12 pages)
- R2200 (61 pages)
- 4445-95 (5 pages)
- 32A (7 pages)
- AUTOMATIC XT SPAY GUNS 311051D (38 pages)
- X09 (54 pages)
- R12000 XR (69 pages)
- Paslode 403606-10 (15 pages)
- Extech 380976 (20 pages)
- XLWW (10 pages)
- T2200 XR (51 pages)
- SCSI (48 pages)
- 39-1572 (10 pages)
- 2995 (20 pages)
- Insight Control (64 pages)
- Insight Control (60 pages)
- Software HP Matrix Operating Environment (65 pages)
- Insight Control (77 pages)
- Insight Control (37 pages)
- Insight Control (76 pages)
- Insight Control (79 pages)
- Insight Control (44 pages)
- Insight Control (52 pages)
- Insight Control (87 pages)
- Insight Control (59 pages)
- Insight Control (94 pages)
