4 analyzing the server performance, Overview, Online analysis – HP Insight Control User Manual
Page 21: Performing online analysis, Overview online analysis

4 Analyzing the server performance
Overview
This chapter provides you with the various tools available in the performance management for analysis of
the monitored servers and also discusses the different options available for analyzing the information
logged/available for the servers.
The different tools available are:
•
Online Analysis
tool
•
Offline Analysis
tool
Online Analysis
The performance management Online Analysis tool provides an intuitive interface to detail the performance
status and inventory of the monitored components. The monitored components include processor memory,
local and external storage, network storage, network connections, host bus, virtual machine guest, and
virtual machine host components for each server. The tools provided for Online and Offline Analysis are
similar in overall functionality. The major difference in performing Offline Analysis is that the data comes
from a database rather than a real-time data stream.
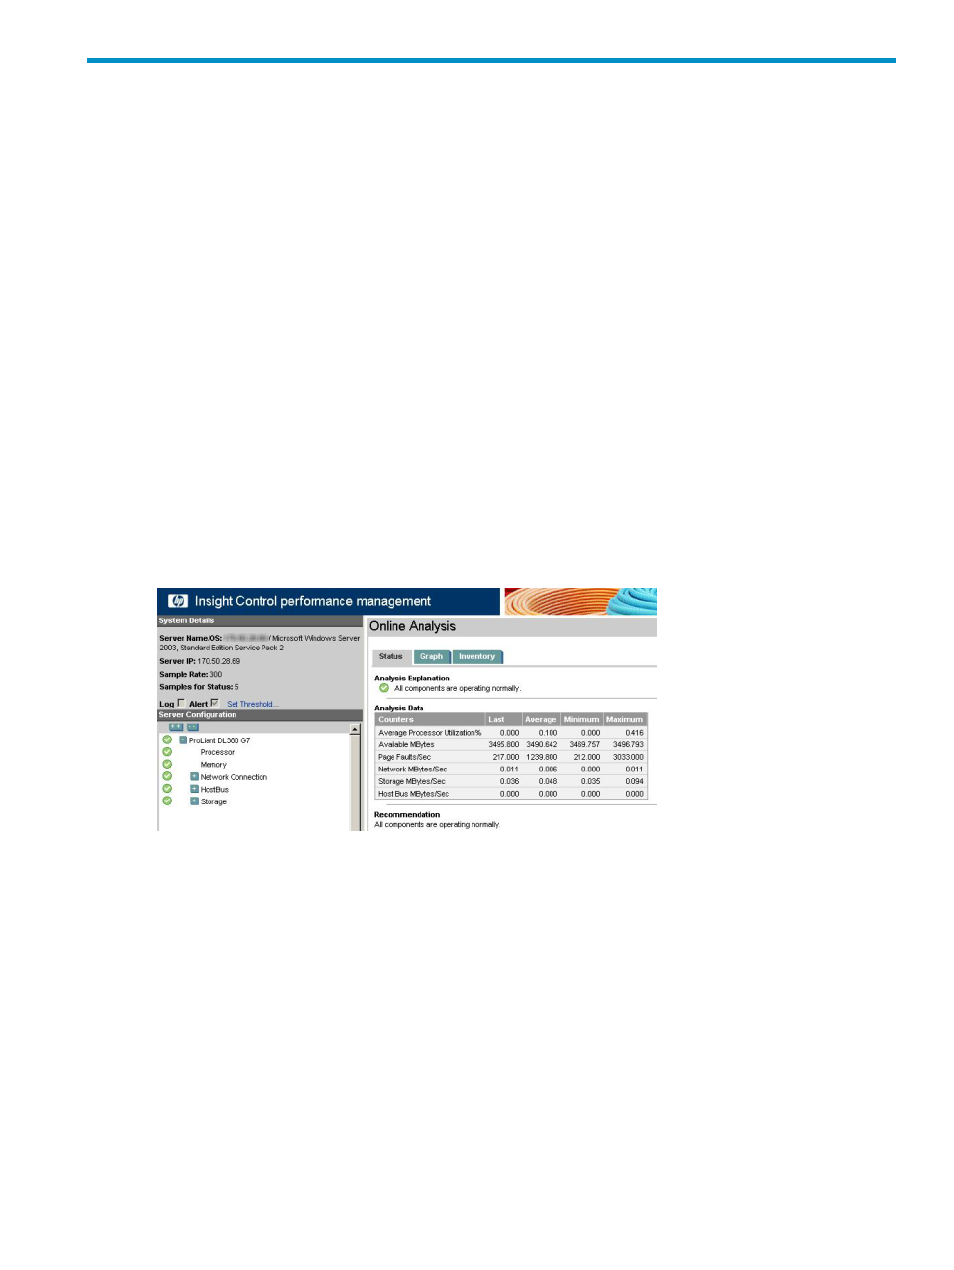
When you select a monitored server icon from the PF column of the Insight Control/Insight Dynamics console
or when you select Diagnose
→Performance Management→Online Analysis from the console toolbar,
the performance management Online Analysis screen appears in a new browser window, as shown in the
following screen. The Online Analysis page displays the performance status view for the server as shown in
the following figure.
Performing Online Analysis
The Online Analysis tool enables the performance data to be viewed from a real-time data stream and
provides an intuitive interface to detail the performance status and inventory of the monitored servers and
their components.
To open the Online Analysis page, choose either of the following options:
•
From the Insight Control/Insight Dynamics console, click on All Systems page.
The All Systems page appears.
Click the monitored server icon on the PF column.
•
Perform the following steps:
From the Insight Control/Insight Dynamics console toolbar, click Diagnose
→Performance
Management
→Online Analysis.
1.
2.
Select the checkbox next to the server or servers for which to view performance data. The checkbox
at the top of the column can be used to select all of the servers listed on the page.
3.
Click Apply Selections
→Run Now. The Online Analysis page appears in a new window.
Overview
21
