The xcxclus utility display, The xcxclus utility display icon, Figure 7-1 – HP XC System 3.x Software User Manual
Page 64

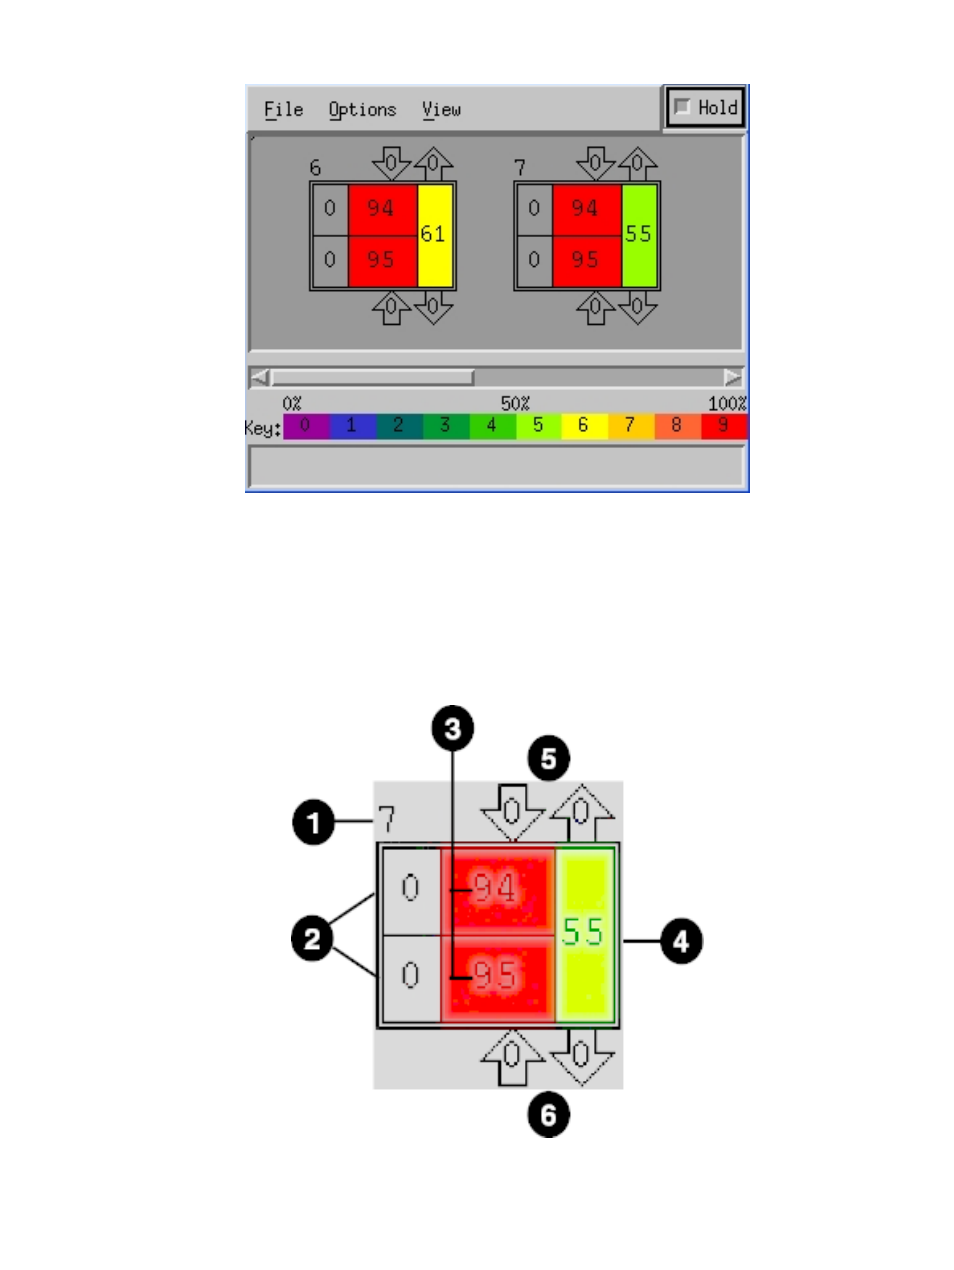
Figure 7-1 The xcxclus Utility Display
The icons show most node utilization statistics as a percentage of the total resource utilization. For example,
indicates that the CPU cores are almost fully utilized, at 94 per cent, and 95 per cent of available
CPU time. These values are rounded to the nearest integer.
Selecting (that is, clicking on) an icon automatically invokes another utility, xcxperf, described in
the xcxperf Utility to Display Node Performance” (page 66)
. It displays a graph of the corresponding
node's performance.
shows a node from
with numeric designators for the individual portions.
Figure 7-2 The xcxclus Utility Display Icon
The following describes the format of the node icons:
64
Monitoring Node Activity
See also other documents in the category HP Software:
- Scripting Toolkit for Linux (68 pages)
- Scripting Toolkit for Windows 9.50 (62 pages)
- Scripting Toolkit for Windows 9.60 (62 pages)
- Storage Area Manager (13 pages)
- Core HP-UX (5 pages)
- Matrix Operating Environment Software (223 pages)
- Matrix Operating Environment Software (136 pages)
- Matrix Operating Environment Software (34 pages)
- Matrix Operating Environment Software (63 pages)
- Matrix Operating Environment Software (67 pages)
- Matrix Operating Environment Software (128 pages)
- Matrix Operating Environment Software (104 pages)
- Matrix Operating Environment Software (75 pages)
- Matrix Operating Environment Software (245 pages)
- Matrix Operating Environment Software (209 pages)
- Matrix Operating Environment Software (71 pages)
- Matrix Operating Environment Software (239 pages)
- Matrix Operating Environment Software (107 pages)
- Matrix Operating Environment Software (77 pages)
- Insight Management-Software (148 pages)
- Matrix Operating Environment Software (80 pages)
- Insight Management-Software (128 pages)
- Matrix Operating Environment Software (132 pages)
- Matrix Operating Environment Software (74 pages)
- Matrix Operating Environment Software (76 pages)
- Matrix Operating Environment Software (233 pages)
- Matrix Operating Environment Software (61 pages)
- Matrix Operating Environment Software (232 pages)
- Matrix Operating Environment Software (70 pages)
- Matrix Operating Environment Software (120 pages)
- Matrix Operating Environment Software (36 pages)
- Matrix Operating Environment Software (99 pages)
- Matrix Operating Environment Software (192 pages)
- Matrix Operating Environment Software (198 pages)
- Matrix Operating Environment Software (66 pages)
- Matrix Operating Environment Software (95 pages)
- Matrix Operating Environment Software (152 pages)
- Matrix Operating Environment Software (264 pages)
- Matrix Operating Environment Software (138 pages)
- Matrix Operating Environment Software (137 pages)
- Matrix Operating Environment Software (97 pages)
- Matrix Operating Environment Software (33 pages)
- Matrix Operating Environment Software (142 pages)
- Matrix Operating Environment Software (189 pages)
- Matrix Operating Environment Software (58 pages)
