5 plotting the node performance data, The xcxperf utility display – HP XC System 3.x Software User Manual
Page 67
$ xcxperf -o test
Figure 7-4 The xcxperf Utility Display
Specifying the data file prefix when you invoke the xcxperf utility from the command line plays back
the display according to the recorded data. The following command line plays back the test.xcxperf
data file:
$ xcxperf test
The graphical display differs from the depiction in
because there is an additional pull-down
menu named Control next to the File menu. Choosing the Play... option from the Control menu opens a
dialog box that you can use to control the playback.
For additional information about this utility, see xcxperf(1).
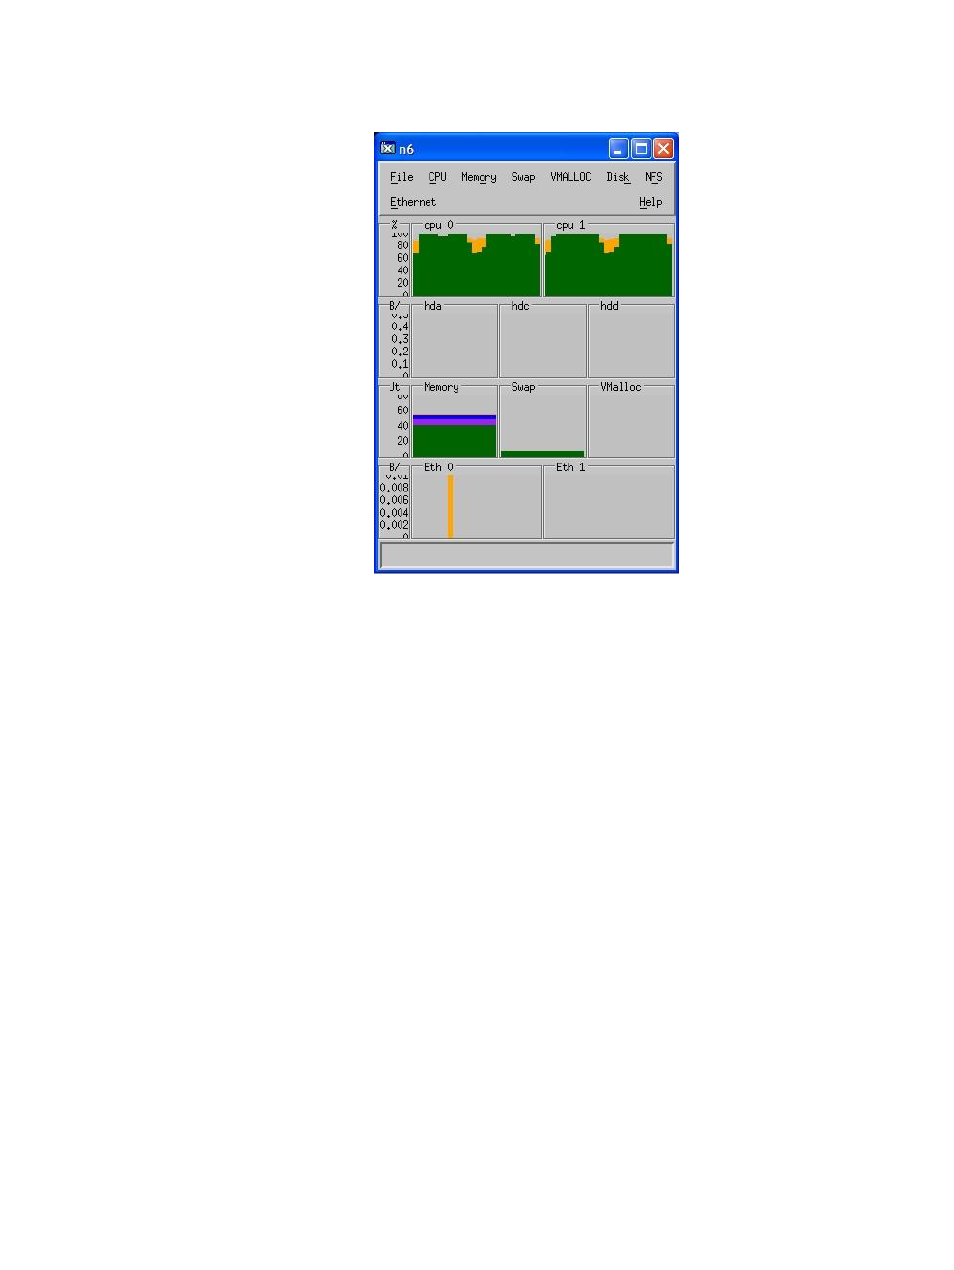
7.5 Plotting the Node Performance Data
The perfplot utility enables you to graph the data from the datafiles generated with the xcxperf utility.
is a representation of the output from the perfplot utility for the DB.n6.xcxperf data file.
This data file is created when the xcxperf utility is run with the -o DB option, as shown here:
$ /opt/xtools/bin/perfplot DB
Node n6 is one of the nodes in the job allocation.
7.5 Plotting the Node Performance Data
67
- Scripting Toolkit for Linux (68 pages)
- Scripting Toolkit for Windows 9.50 (62 pages)
- Scripting Toolkit for Windows 9.60 (62 pages)
- Storage Area Manager (13 pages)
- Core HP-UX (5 pages)
- Matrix Operating Environment Software (223 pages)
- Matrix Operating Environment Software (136 pages)
- Matrix Operating Environment Software (34 pages)
- Matrix Operating Environment Software (63 pages)
- Matrix Operating Environment Software (67 pages)
- Matrix Operating Environment Software (128 pages)
- Matrix Operating Environment Software (104 pages)
- Matrix Operating Environment Software (75 pages)
- Matrix Operating Environment Software (245 pages)
- Matrix Operating Environment Software (209 pages)
- Matrix Operating Environment Software (71 pages)
- Matrix Operating Environment Software (239 pages)
- Matrix Operating Environment Software (107 pages)
- Matrix Operating Environment Software (77 pages)
- Insight Management-Software (148 pages)
- Matrix Operating Environment Software (80 pages)
- Insight Management-Software (128 pages)
- Matrix Operating Environment Software (132 pages)
- Matrix Operating Environment Software (74 pages)
- Matrix Operating Environment Software (76 pages)
- Matrix Operating Environment Software (233 pages)
- Matrix Operating Environment Software (61 pages)
- Matrix Operating Environment Software (232 pages)
- Matrix Operating Environment Software (70 pages)
- Matrix Operating Environment Software (120 pages)
- Matrix Operating Environment Software (36 pages)
- Matrix Operating Environment Software (99 pages)
- Matrix Operating Environment Software (192 pages)
- Matrix Operating Environment Software (198 pages)
- Matrix Operating Environment Software (66 pages)
- Matrix Operating Environment Software (95 pages)
- Matrix Operating Environment Software (152 pages)
- Matrix Operating Environment Software (264 pages)
- Matrix Operating Environment Software (138 pages)
- Matrix Operating Environment Software (137 pages)
- Matrix Operating Environment Software (97 pages)
- Matrix Operating Environment Software (33 pages)
- Matrix Operating Environment Software (142 pages)
- Matrix Operating Environment Software (189 pages)
- Matrix Operating Environment Software (58 pages)