HP Integrity NonStop J-Series User Manual
Page 80

Guardian Performance Analyzer (GPA) User Guide
– (544541-006) Page 80 of 131
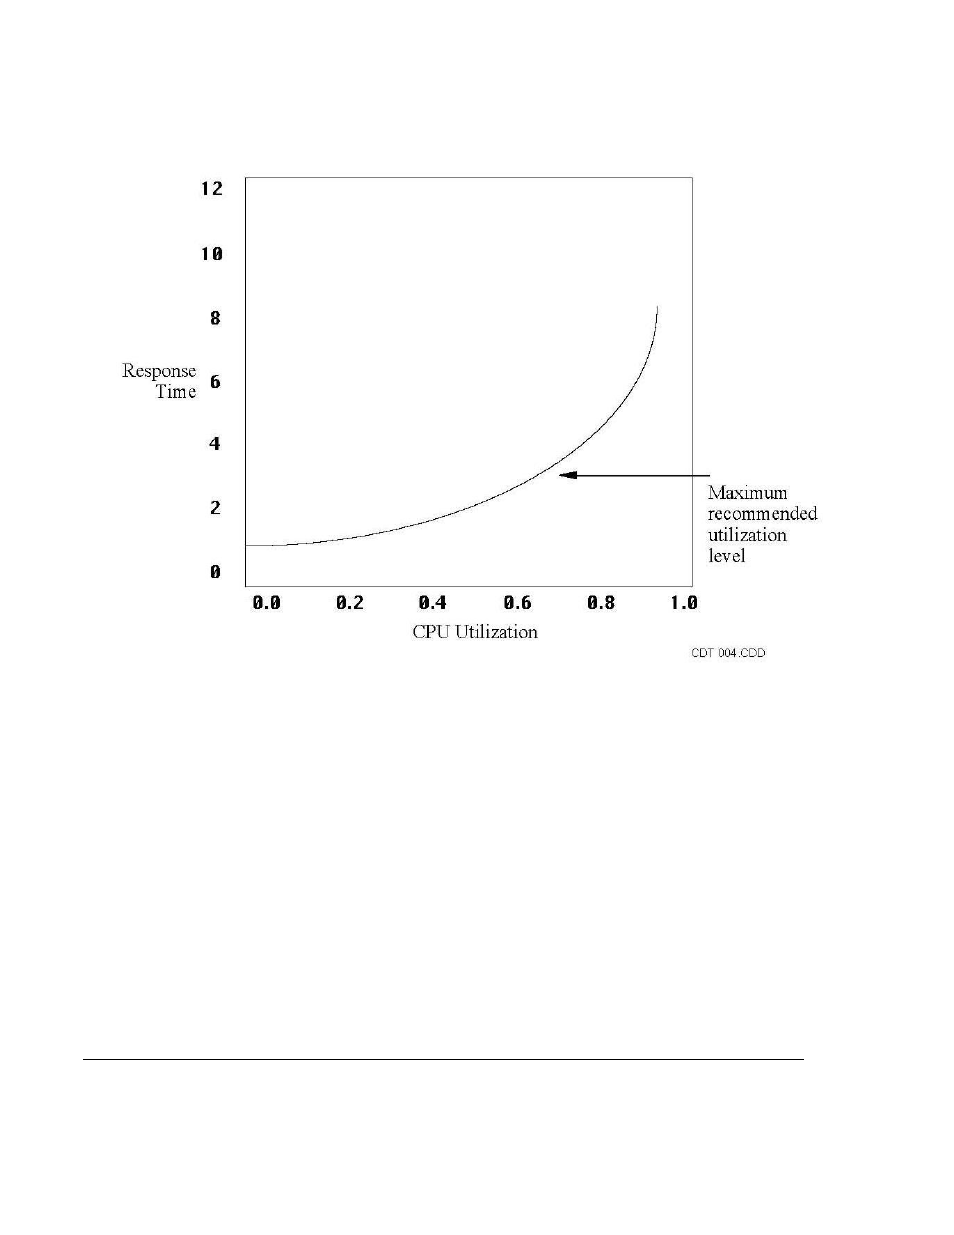
Figure 4-1. Response Time as a Function of CPU Utilization
A rundown of the global performance indicators for \NODEA (Example 4-4) shows that the
processor load balance on the system is poor and that there is excessive disk queuing.
The cache performance, with an average cache hit percentage of 83.2, is also
deficient. However, the overriding problem on this node is a serious shortage of
memory, as indicated by the node swap rate and the memory subsystem performance
score (discussed later).
Example 4-4. Global Performance Indicators for \NODEA
III. GLOBAL PERFORMANCE INDICATORS
EXCESSIVE DISPATCHING : NO INDEX LEVELS > 2 : NO
PROCESSOR LOAD BALANCE : POOR OVER UTILIZED DISK : NO
OVER UTILIZED NODE : NO CACHE FAULT DETECTED : NO
OVER UTILIZED CPU : NO TRANSIENT PROCESSING : NO
DISK VOLUME QUEUING : YES BLOCKED REQUESTS : NO
AVERAGE CACHE HIT % : 83.20% TOTAL CACHE CALL RATE: 25.00 /SEC
