Measurement screen shifts in specific period – KYORITSU 6310 Quick Manual User Manual
Page 23
−
21 −
Demand measurement
KEW6310
KEW6310
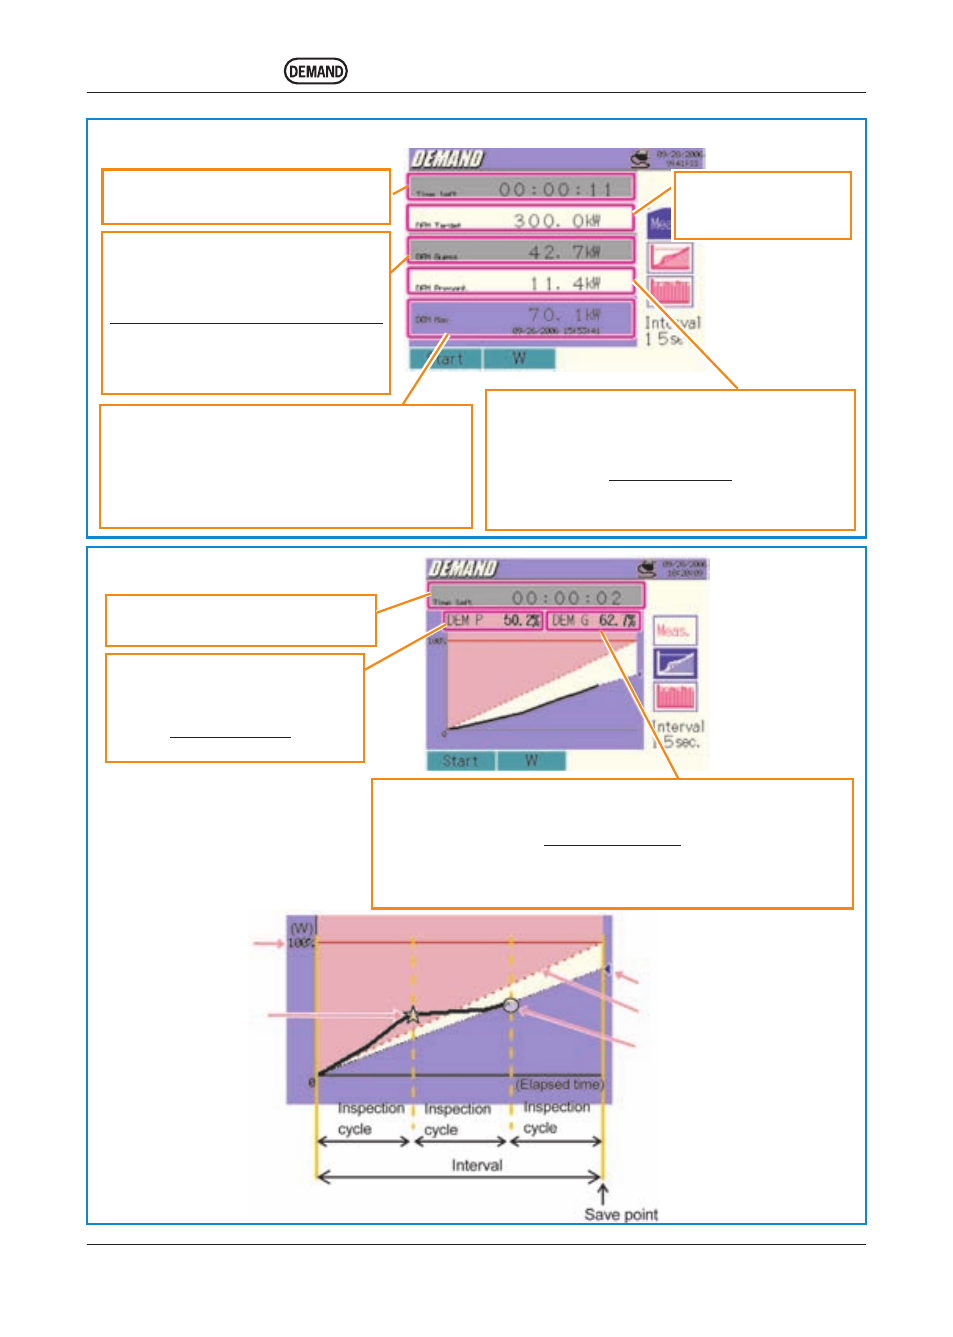
Measurement Screen
Shifts in specific period
Digital output signal
warns when the
predicted value
exceeds the target
value.
Measured max demand with time & date
information
Max demand recorded in a measuring period is
displayed. Displayed value will be refreshed if
any higher demand is detected.
Predicted value
Predicted demand value when preset
demand interval elapses under present load.
(
Present value) × (preset interval)
(elapsed time)
* Integration and calculations are
done as time elapses.
Prediction
Percentage of the predicted value against the target value.
(predicted value)
(target value)
Arrow mark on the graph (
▲ ) is blue while the value is within the
target demand, and becomes red when the target value is exceeded.
Remaining time (Time left)
Demand interval is counted down.
Target value
Predicted value
Target value
Demand value
(present value)
Present value
Demand value (average power) within a demand
interval.
(WP+)×(1 hour)
(interval)
* Integration and calculations are done as time elapses.
Remaining time (Time left)
Demand interval is counted down.
Load factor
Percentage of the present value
against the target value.
(present value)
(target value)
Target value
Should be set for
each measurement.