Integration value measurement, Steps for measurement, Switching displays / viewing w range – KYORITSU 6310 Quick Manual User Manual
Page 19: Save data
−
17 −
6.
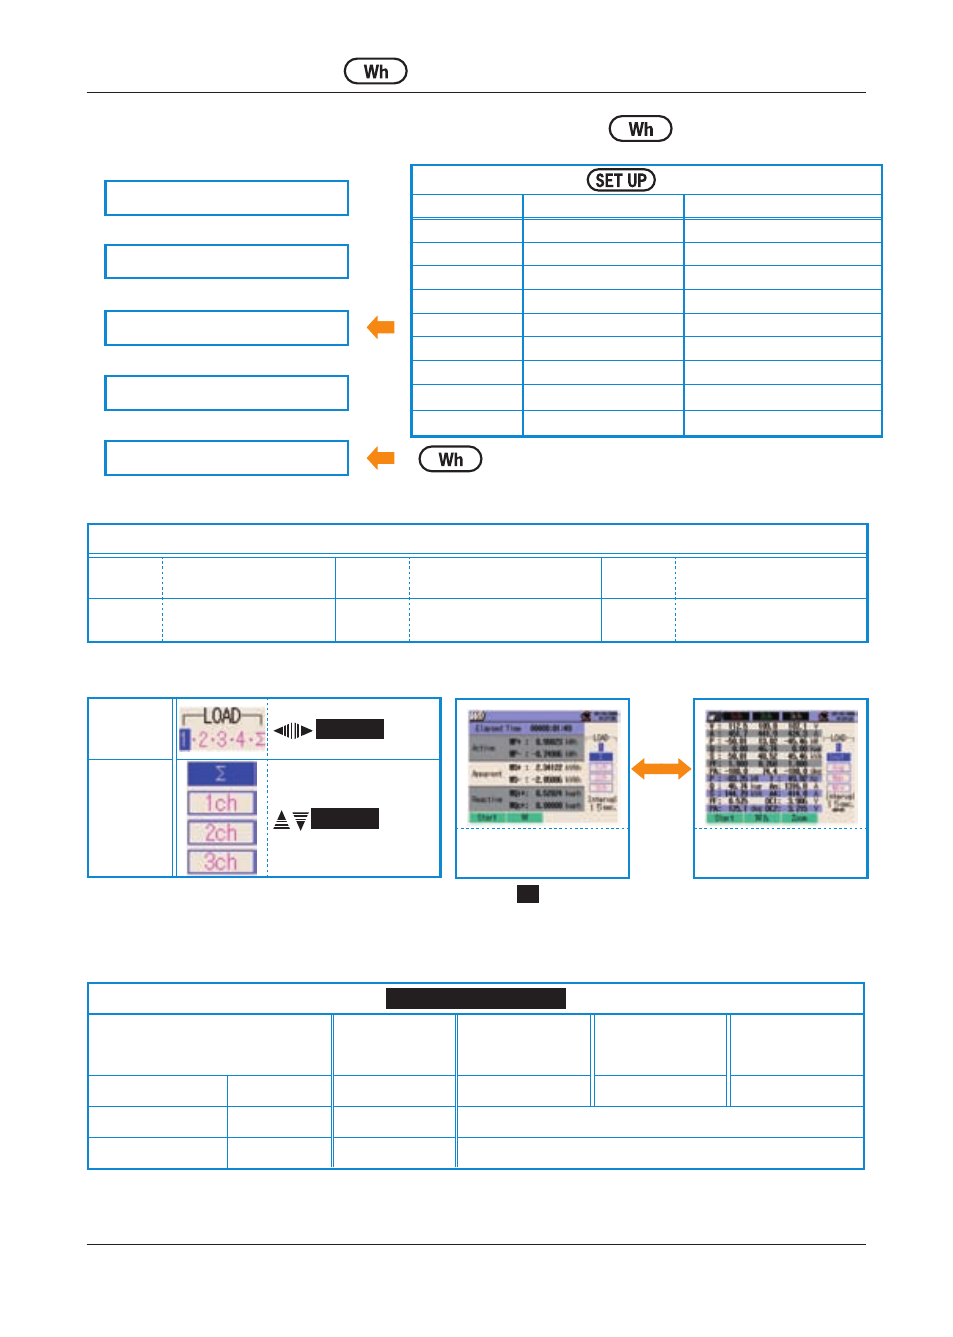
Integration value measurement
Steps for measurement
Ensuring your safety
↓
Preparation for measurement
↓
Setting
↓
Wiring
↓
Integration value measurement
Range
* Readings are displayed right after the recording of integration value measurement starts.
Symbol displayed on the LCD
WP+
Active electric energy
(consumption)
WS+
Apparent electric energy
(consumption)
WQi+
Reactive electric energy
(lagging)
WP-
Active electric energy
(regenerating)
WS-
Apparent electric energy
(regenerating)
WQc+
Reactive electric energy
(leading)
Switching displays / Viewing W Range
Select
a system
Cursor
Key
Select
a channel
Cursor
Key
* Press
F2
Key to switch on the displays for Wh Range and W
Range.
Save data
File ID : 6310-02
Saved time & date
ELAPSED TIME
Active Power energy
(consumption /
regenerating )
Apparent Power energy
(consumption /
regenerating )
Reactive Power energy
(consumption /
regenerating )
DATE
TIME
ELAPSED TIME
INTEG_WP
INTEG_WS
INTEG_WQ
yyyy/mm/dd
h:mm:ss
h:mm:ss
(±)x.xxxxxE±nn
year/month/ date hour:min:sec hour:min:sec
(±) value x 10
±n
* Reactive power (consumption :+ / regenerating :- ) will be recorded with phase information: lagging (i) or leading (c).
* At Wh Range, data measured at W Range and above measurement data are recorded at the same time.
KEW6310
Integration value measurement
KEW6310
Range
Basic Setting Measurement setting
Save Setting
Wiring
Interval
Recording method
V Range
Save item (Wh)
Recording start
VT Ratio
・Inst value
Recording termination
Clamp Sensor ・Avg value
Destination to save data
A Range
・Max value
Destination to save screen shot
CT Ratio
・Min value
Filter
・Details
DC V
Frequency
Display for
Wh Range
Display for
W Range