GW Instek GOS-6100 Series User Manual
Page 25
GOS-6112 OSCILLOSCOPE
USER MANUAL
43
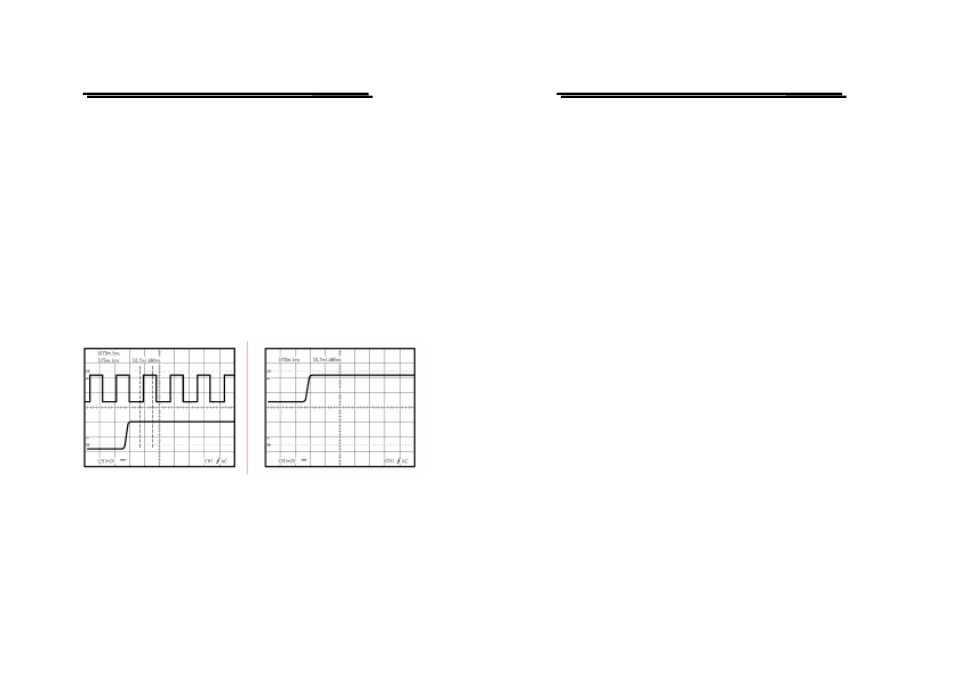
2. Set the MAIN/ALT/DELAY button to ALT mode, and set the time
range of the DELAY TIME/DIVE control to be magnified.
The figure 5-9 below shows the main and delayed sweeps appear
simultaneously on the screen, and the window sector will appear.
3.Adjust the DELAY TIME control to move continuously the window
sector. Bring the window sector to the position to be magnified. Then,
the waveform between the window sector is magnified to occupy the
full area of the screen.
4.If necessary, press the TRACE SEP pushbutton to set the LED on. The
delayed sweep trace can be shifted vertically about ±3 divisions with
respect to the main sweep trace for the convenience of observation by
the POSITION control.
Figure 5-9 ALT Mode
Figure 5-10 Delay Mode
5.Set the DELAY mode to measure the magnified waveform only by
pressing the MAIN/ALT/DELAY button. The magnified waveform
shown in figure 5-10.
GOS-6112 OSCILLOSCOPE
USER MANUAL
44
Magnifying Waveform Events
Use the ×10 MAG pushbutton to view small portions of a waveform as
which is too far back from the starting point to view by using the
TIME/DIV control. To use the ×10 MAG button, proceed the following
steps:
1. Adjust the TIME/DIV to the fastest sweep that displays the event.
2. Rotate the HORIZONTAL POSITION control to move the event to
display on the center of screen.
3. Press the ×10 MAG button to switch the MAG LED on.
When above procedures have been done, the displayed waveform will be
expanded 10 times to the right and left from the center of screen as center
of expansion.
Operating HO (Hold off time) Control
When the measured signal is a complex waveform with two or more
repetition frequencies (period), triggering with the LEVEL control alone
may not be sufficient to attain a stable waveform display. In such a case,
the sweep can be stable synchronized to the measured signal waveform
by adjusting the HO (Hold off) time of the sweep waveform.
Figure 5-11(a) shows several different waveforms which overlapped on
the screen, marking the signal observation unsuccessful when the hold
off is set to minimum (the HO-LED is dark).
Figure 5-11(b) shows the undesirable portion of the signal is held off.
The same waveforms are displayed on the screen without overlapping.