GW Instek GOS-6103C User Manual
Page 27
GOS-6103C OSCILLOSCOPE
USER MANUAL
49
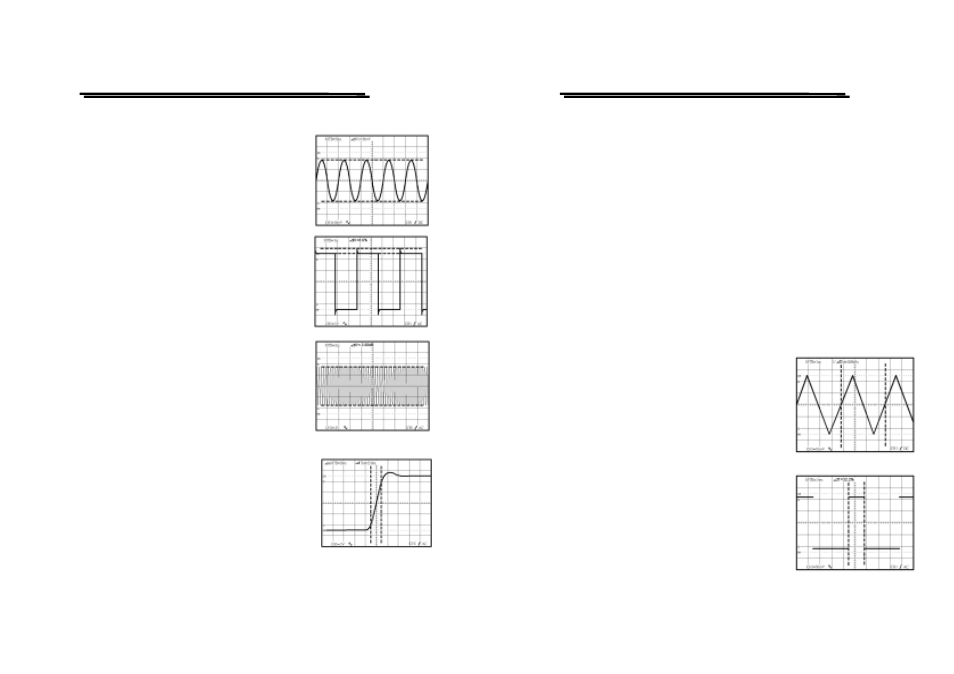
Figure 5-14: Cursor Measurement
(a).Typical △ V (Voltage difference) for AC
voltage.
When both CH1 and CH2 are turned on, the
measurement value of CH1( △ V1) or
CH2(△ V2) can be displayed by pressing
and holding the △V1/2 pushbutton.
(b).Typical △V%(Voltage percentage) cursor
measurement for overshoot of square
waveform.
A voltage percentage measurement is done
by first setting a reference for the full scale
(amplitude) waveform: 5div=100%.
(c).Typical
△ VdB(voltage gain) cursor
measurement for –3dB bandwidth
appli-cation.
The percentage reference is: 5div=0db.
The measurement values calculate the
voltage gain from the formula:
△VdB=20 log(△Vdiv/5div)
(d).Typical
△ T(Time difference) cursor
measurement for rise time.
Proceed rise-time or fall-time measurement
requiring some additional signal scaling by
using the graticale rise-time measurement aids.
Number 0%, 10, 90 and 100 are etched near
the left vertical gratical line. Use the following
steps as a guideline to in making rise-time measurement:
GOS-6103C OSCILLOSCOPE
USER MANUAL
50
1. Set the VOLTS/DIV and VAR controls to provide an exact
five-division vertical display.
2. Use the vertical POSITION control to control the negative amplitude
of the signal on the 0% reference line and the positive amplitude on
the 100% reference line.
3. Increase the TIME/DIV setting to stretch out the rising edge of the
waveform as much as possible to improve the cursor placement
accuracy.
4. Use the C1-POSITION control to align the cursor 1 to the rising
edge at the point where it crosses the 10% reference graticule line.
Then use the C2-POISITION control to align the cursor 2 to the
point where the rising edge crosses the 90% graticule line and read
the rise time displayed in the CRT readout.
(e).Typical 1/△T cursor function for frequency
measurement.
When the two cursors are superimposed at
two edge points of the one period waveform
by the C1-POSITION and C2-POSITION
controls, the measurement value is displayed
in frequency units on the upper side of the
screen.
(f).Typical △ T%(Time difference percentage)
cursor function for duty-cycle measurement
of square waveform.
A time difference percentage measurement is
done by first setting a reference for the full
cycle of waveform period: 5div=100%.