Yokogawa ISC450 4-Wire Analyzer for Inductive Conductivity User Manual
Page 52
44
IM 12D06D05-01E
2/3
QIS 12D06D05-01E
This test is done on the “HIF” display of “Factory Mode”.
a. Touch the [Setup] icon.
b. Touch the [Commissioning].
c. Touch the [Advanced setup].
d. Touch the [Factory adjustment].
e. Enter a password.
f. Select the [Factory Mode] in “Key.”
g. Select the [HIF] in “Execute.”
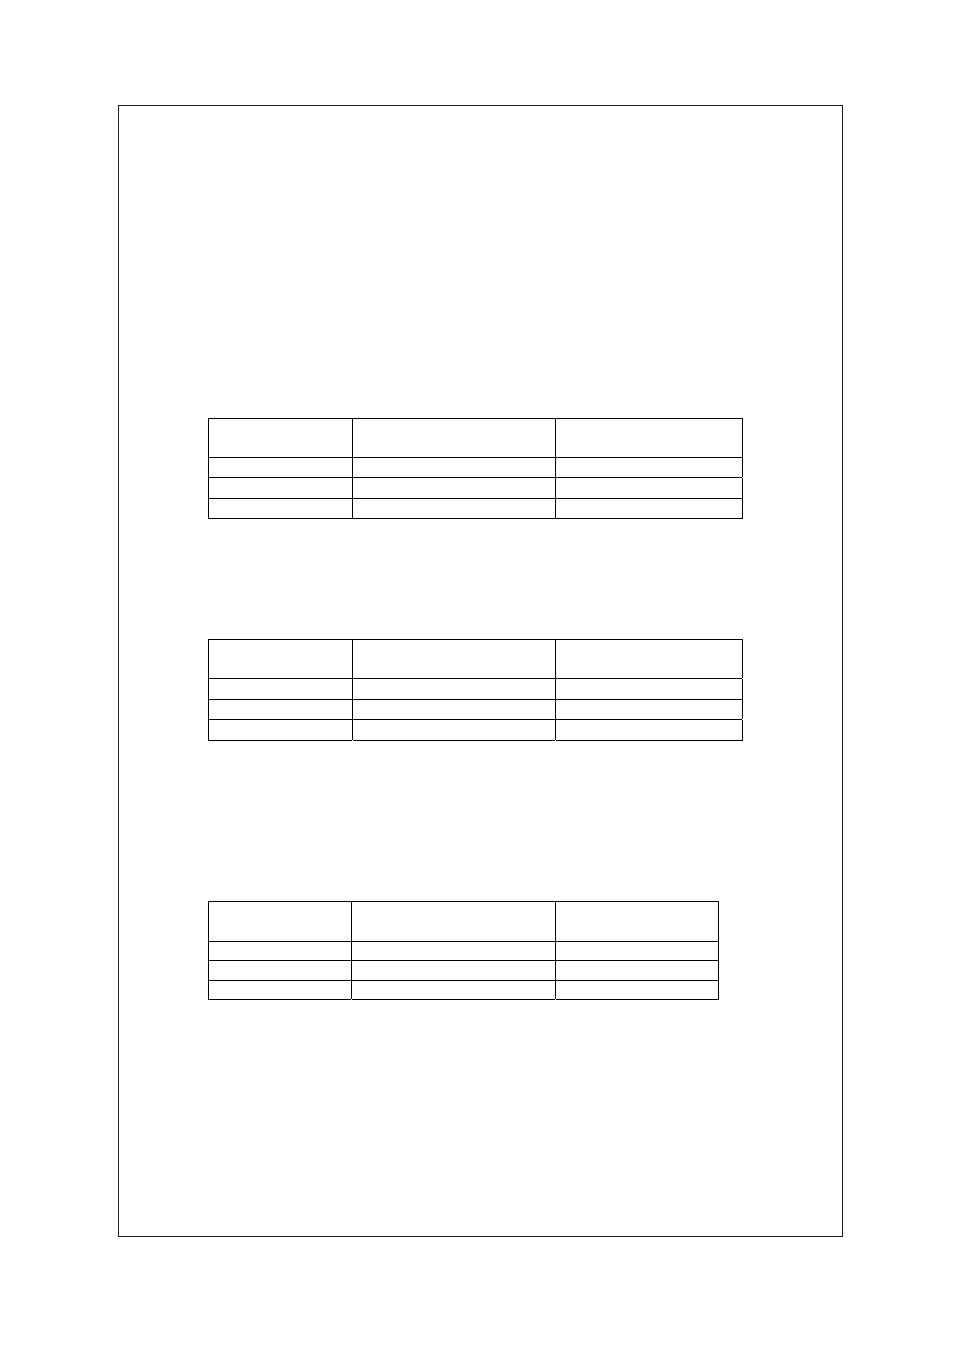
Wind ten turns of wire onto ISC40 sensor. When the resistance of the decade resistance
box 2 to the corresponding value “RANGE1” to “RANGE3” in Table 1 is set, check the
data display and the value must be within the range shown in Table 1.
Table 1
RANGE
Resistance (Ω) of
Decade Resistance Box 2
Data Display (Ω)
RANGE1
150
1.5 ±0.01
RANGE2
1.5k
15 ±0.1
RANGE3
15k
150 ±1
After the above test is completed, wind one turn of wire onto ISC40 sensor.
When the resistance of the decade resistance box 2 to the corresponding value
“RANGE4” to “RANGE6” in Table 2 is set, check the data display and the value must be
within the range shown in Table 2.
Table 2
RANGE
Resistance (Ω) of
Decade Resistance Box 2
Data Display (Ω)
RANGE4
1.5k
1.5k ±0.01k
RANGE5
15k
15k ±0.2k
RANGE6
150k
150k ±12k
After the above test is completed, touch the [Exit] to return to the “HIF” display.
3.4 Temperature
Indication Check
Following Section 3.3, select the [PT1000] in “Temperature” of the “HIF” display.
In this state, change the resistance of the decade resistance box 1 and check the data
display. The value on the data display must be within the range shown in Table 3.
Table 3
Temperature (°C)
Resistance (Ω) of
Decade Resistance Box 1
Data Display (°C)
–10
960.9
–10 ±0.3
25
1097.3
25 ±0.3
130
1498.2
130 ±0.3
After the above test is completed, touch the [Exit] to return to the “HIF” display.
3.5 Current Output Test
Following Section 3.4, select the [Check] in “mA outputs” of the “HIF” display. “Set value
4.000 mA” appears at the bottom of the display. Select “Next value” in the “Command”
and touch “Enter,” the value on the data display increases in steps of 4 mA. Check the
current outputs 1 and 2 corresponding to the data display, the current output must be
within the range shown in Table 4.