Figure 36 – tx emphasis ref2 results, Qphy-sas3 software option – Teledyne LeCroy QPHY-SAS3 User Manual
Page 39
QPHY-SAS3 Software Option
After the completion of this test the oscilloscope is in the following configuration:
Figure 35 - Oscilloscope Configuration after REF2 Test
Shown on this screen:
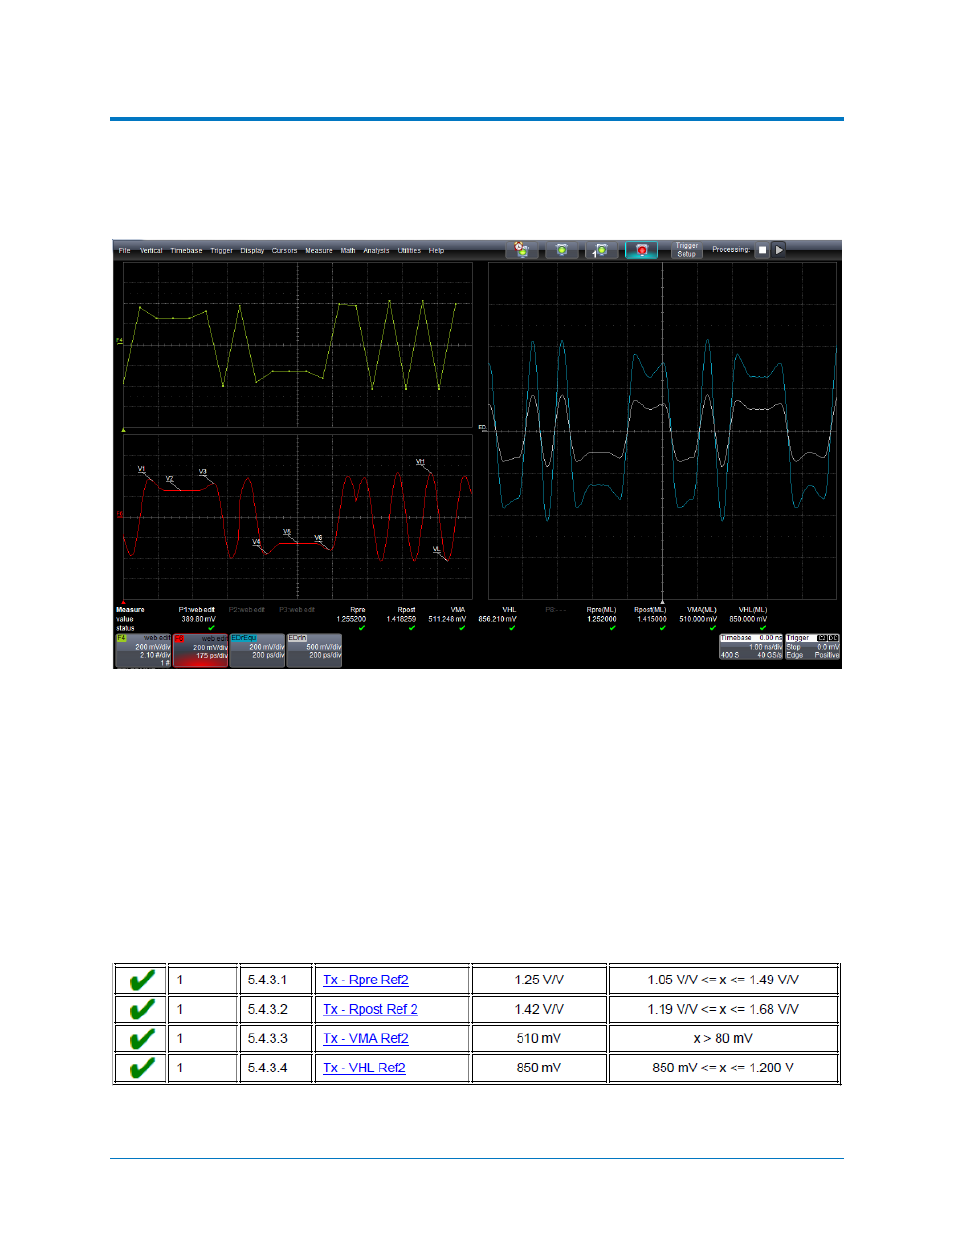
• F4 is a plot of the peak voltage values which correspond to V1-V6, VH, and VL. These are the
values which are used in the calculation of the first set of Rpre, Rpost, VMA, and VHL values in
the Measurement table on the screen.
• F6 is a representation of where V1-V6, VH, and VL occur on the acquired waveform. This waveform
is an average of all instances where the pattern was identified in the acquired waveform. The
beginning section of the waveform is the positive 5-UI portion, the next is the negative 5-UI
portion, and the last portion is the alternating 101.
• EDrRqu is the equalized waveform. Displayed on screen is a zoom of this waveform.
• EDrIn is the differential input waveform before any equalization has been applied. Displayed on
screen is a zoom of this waveform.
Figure 36 – Tx Emphasis Ref2 Results
922545 Rev A
39