Figure 20 - vpp, vma and eq results, Qphy-sas3 software option – Teledyne LeCroy QPHY-SAS3 User Manual
Page 27
QPHY-SAS3 Software Option
Figure 19 - Oscilloscope Configuration after the Vpp, VMA, and EQ tests
Shown on this screen:
• F2 is Eye Diagram created from the input signal using a 2 pole PLL with a natural frequency of
3.9MHz and a damping factor of .800. This is shown for information only.
• F4 is a histogram of the input waveform.
• F5 is this histogram converted to a waveform (this is required to perform certain measurements on
the histogram).
• F6 is the differential input waveform. This is calculated by subtracting the negative input from the
positive input.
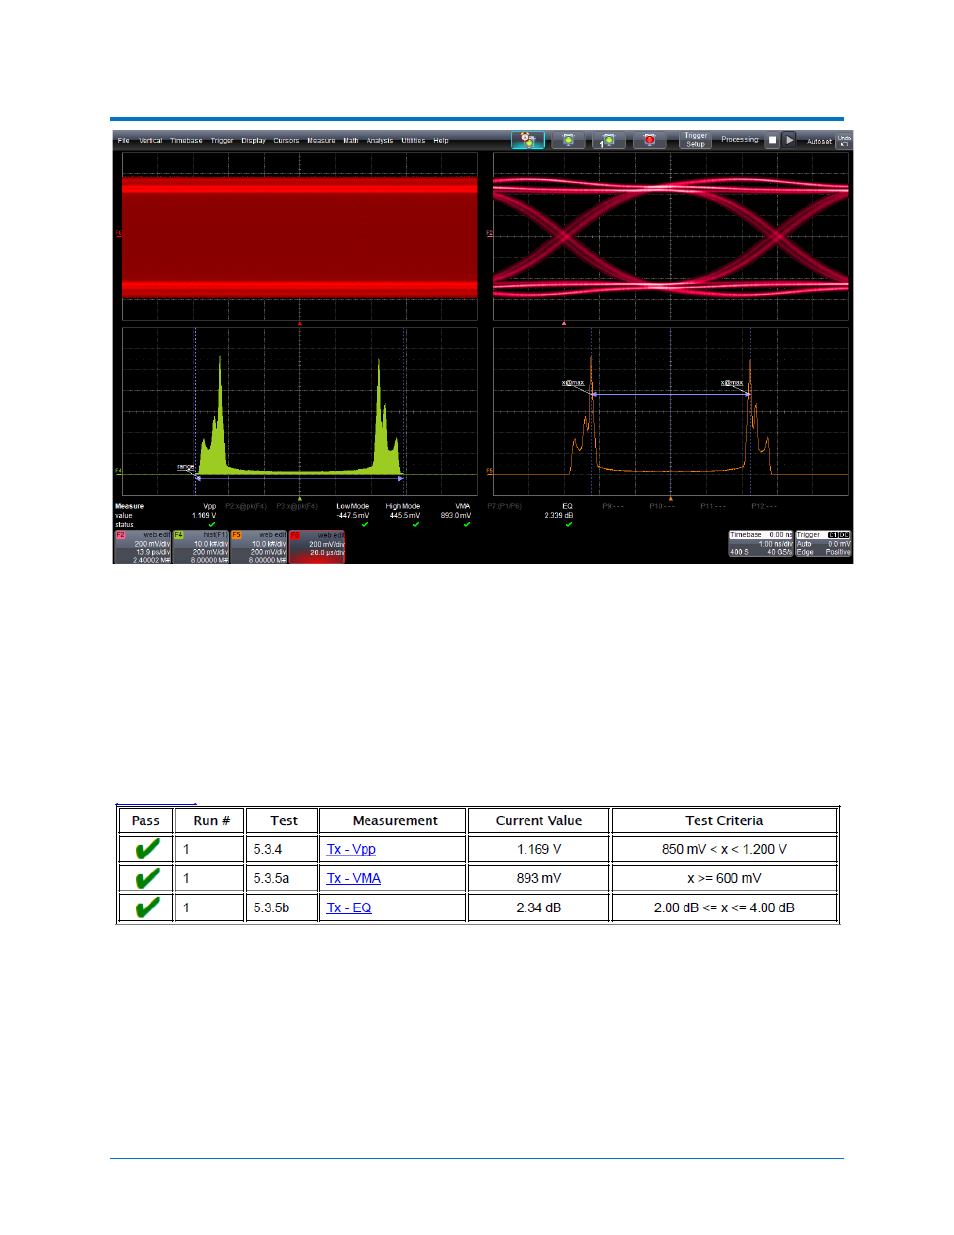
Figure 20 - Vpp, VMA and EQ Results
In the Measure section:
• Vpp (P1) is measuring the full range of the F4 histogram. This is the measured result for Tx - Vpp
(5.3.4). This value must be between 850mV and 1.2V in order to pass this test.
• LowMode (P4) is the maximum peak from the left side of the F5 waveform. This represents the de-
emphasized low voltage level of the signal.
922545 Rev A
27