Figure 10 - oob test results – Teledyne LeCroy QPHY-SAS3 User Manual
Page 20
• F8 is a view of the Differential Signal after it has been filtered by the 4.5GHz low-pass Butterworth
filter. This is calculated by subtracting the negative input from the positive input. This signal is
used to create many of the traces described earlier.
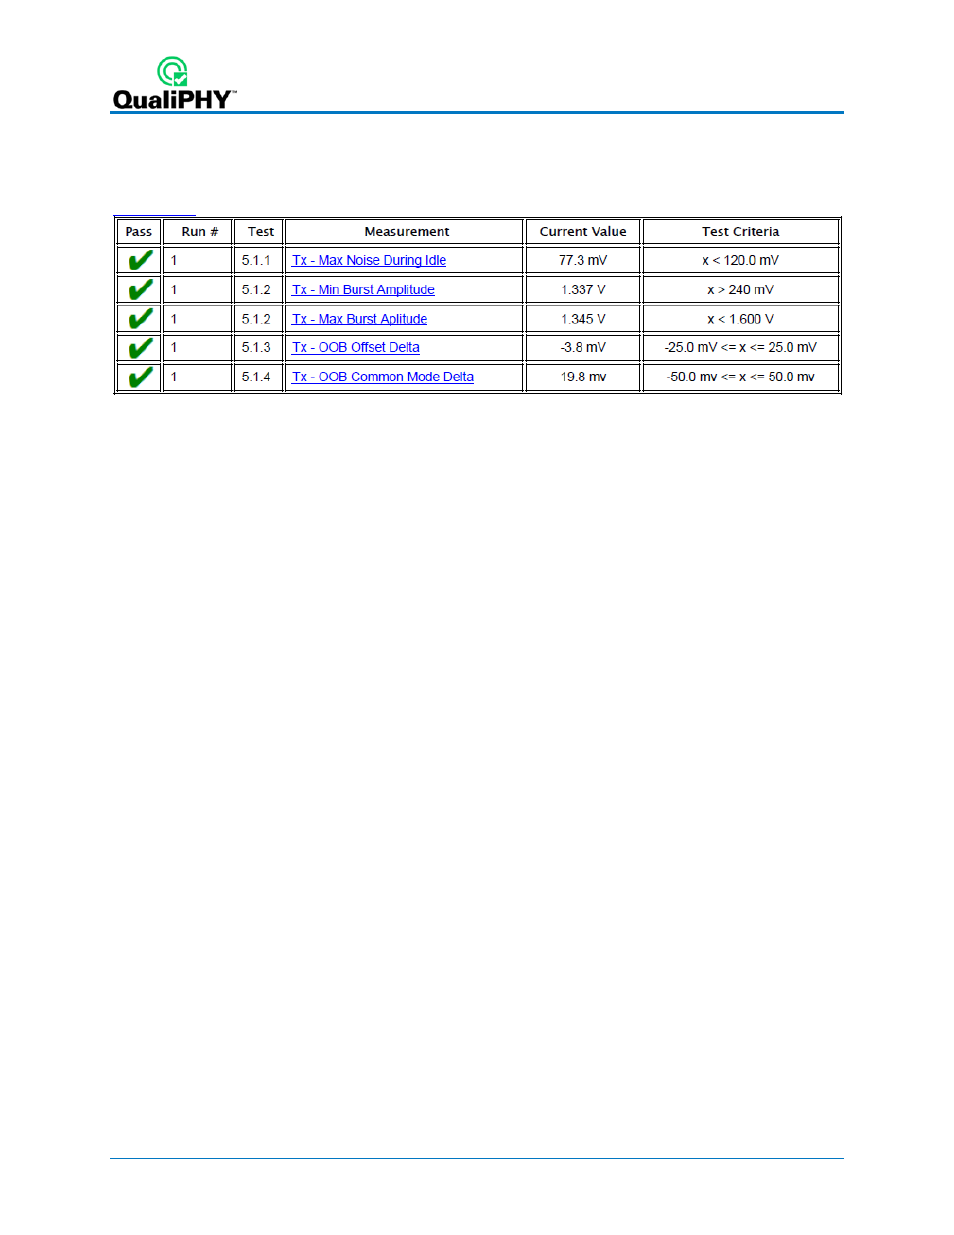
Figure 10 - OOB Test Results
In the Measure section:
• IdleNoise (P1) is the peak-to-peak measurement of F3 (idle differential signal). This is the measured
value for Tx – Max Noise During Idle (5.1.1). This value must be less than 120mV(P-P) in order
to pass the test.
• OffsetDelta (P3) is the mean amplitude of F4 (burst differential signal). This is the measured value
for Tx- OOB Offset Delta (5.1.3). This value must be between -25mV and 25mV (inclusive) in
order to pass the test.
• BurstAmpl (P4) is the peak-to-peak value of F4 (burst differential signal). This is the measured
value for Tx – Max Burst Amplitude and Tx – Min Burst Amplitude (5.1.2). The maximum
value must be less than 1.6V and the minimum value must be great than 240mV in order to pass
this test.
• CMMdelta (P7) is the difference between the mean of the Burst Common Mode Signal (F5) and the
Idle Common Mode Signal (F7). This is the measured value for Tx - OOB Common Mode Delta
(5.1.4). This value must be between +/- 50mV in order to pass this test.
20
922545 Rev A