Figure 22 - rise and fall times results, Qphy-sas3 software option – Teledyne LeCroy QPHY-SAS3 User Manual
Page 29
QPHY-SAS3 Software Option
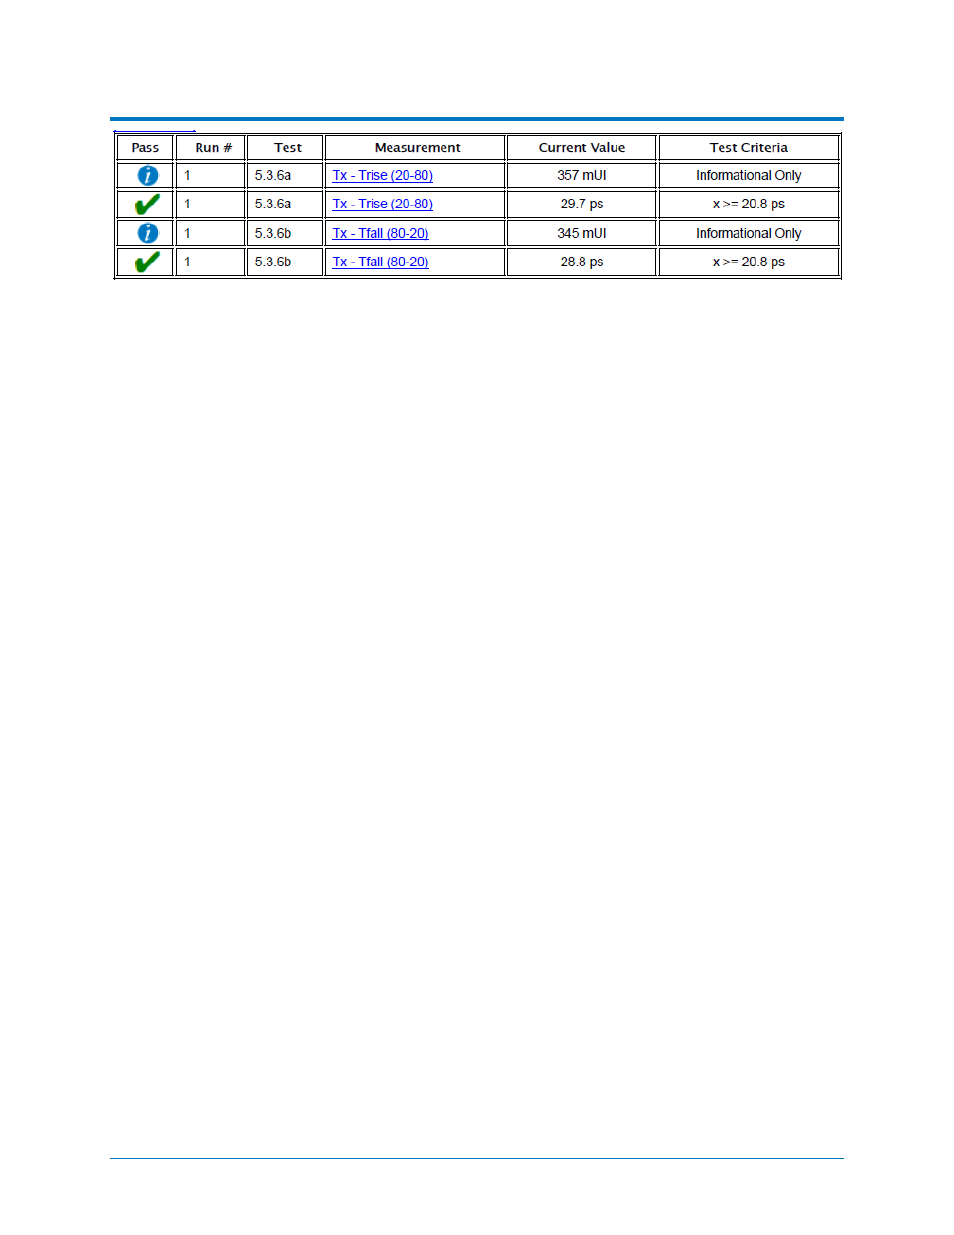
Figure 22 - Rise and Fall Times Results
In the Measure section:
• Rise 20-80 (P1) is the 20-80 rise time of the differential input waveform (F1) displayed in ps. This is
the measured value of TX - Trise (20-80) (5.3.6). The mean of this value for all rising edges in the
differential input must be greater than 20.8 ps in order to pass this test for 12Gbps and greater
than 41.6 ps for 1.5Gbps, 3Gbps, and 6Gbps.
• Fall 80-20 (P2) is the 80-20 fall time of the differential input waveform (F1) displayed in ps. This is
the measured value of TX - Tfall (80-20) (5.3.6). The mean of this value for all falling edges in the
differential input must be greater than 20.8 ps in order to pass this test for 12Gbps and greater
than 41.6 ps for 1.5Gbps, 3Gbps, and 6Gbps.
• Rise(UI) (P3) is the 20-80 rise time converted to Unit Interval. This value is provided only for
additional information.
• Fall(UI) (P4) is the 80-20 fall time converted to Unit Interval. This value is provided only for
additional information.
Tx 5.3.7 and 5.3.8 RJ, TJ (MFTP, MFTP-SSC-DOWN, MFTP-SSC-CENTER)
The purpose of these tests is to verify that the Random Jitter and Total Jitter are within the specification
limits. This test is run for all supported SSC modes (No SSC, SSC Down Spreading, and SSC Center
Spreading). After the completion of these tests the oscilloscope is in the following configuration:
922545 Rev A
29