Analysis – PASCO WA-9611_13 SONOMETER User Manual
Page 22
18
Sonometer
012-03489E
Note
To avoid cross-talk between the detector and driver, keep
the detector coil at least 10 cm from the driver coil during
measurements.
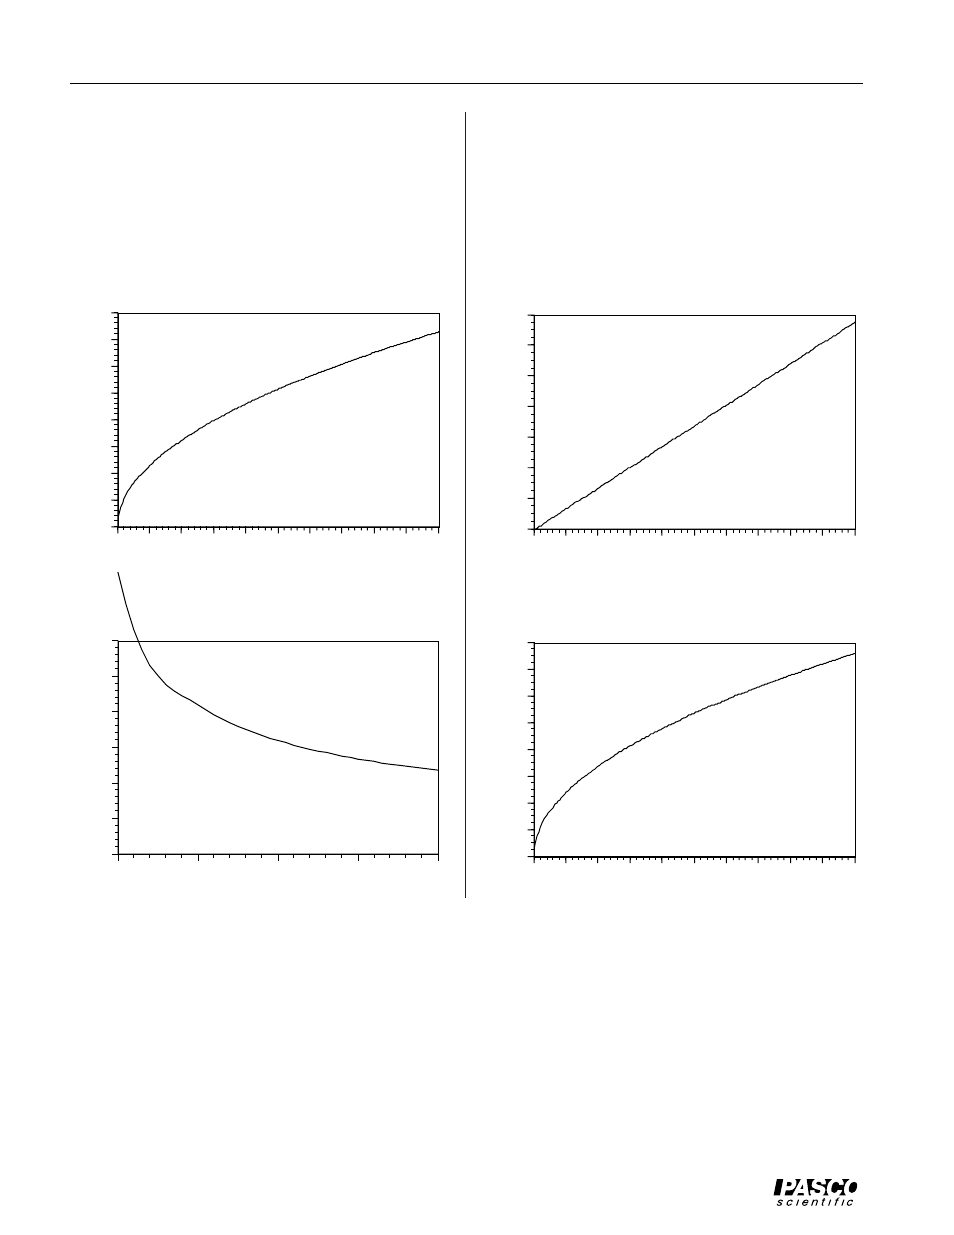
Analysis
➁
X
X
X
X
X
0
50
100
150
200
250
300
350
400
0
5
10
15
20
25
30
35
40
45
50
V
elocity (m/s)
Tension (N)
Velocity v. Tension
f(x) = 5.053730E+1 * (x^5.045696E-1 )
R^2 = 9.994170E-1
µ
= 0.00039 kg/m
Theoretical: 50.637
Experimental constant is 0.2% low.
This verifies that V
`
T
1/2
➂
X
X
X
X
X
0
50
100
150
200
250
300
0.0002
0.0007
0.0012
0.0017
0.0022
V
elocity (m/s)
µ
(kg/m)
f(x) = 5.193590E+0 * (x^-5.088207E-1 )
R^2 = 9.991369E-1
T = 29.4 N
Theoretical: 5.4222
Experimental constant is 4.2% low.
This verifies that V
`
µ
-1/2
Velocity v. Mass/Length
Notes on Conclusions
➀ As shown in Experiment 1, l = 2L/n.
➂ From the Analysis section, V = sqrt(T/µ). Since
l = 2L/n, substituting and rearranging gives us
n = (n/2L)*sqrt(T/µ)
The graphs below verify this equation.
X
X
X
X
X
X
X
X
X
X
X
X
X
X
X
0
200
400
600
800
1000
1200
1400
0
1
2
3
4
5
6
7
8
9
10
Frequency (Hz)
n
Frequency v. n
f(x) = 1.357518E+2*x + -5.901176E+0
R^2 = 9.995529E-1
T = 9.8 N;
µ
= 0.00039 kg/m; L = 0.60 m
Theoretical slope: 1/2L * sqrt(T/
µ
) = 132.099
Experimental value 2.8% above theoretical.
X
X
X
X
X
0
200
400
600
800
1000
1200
1400
1600
0
5
10
15
20
25
30
35
40
45
50
Frequency (Hz)
Tension (N)
f(T) = 2.105721E+2 * (T^5.045696E-1 )
R^2 = 9.994170E-1
Theoretical: (n/2L)*sqrt(1/
µ
) = 210.99
Experimental constant is 0.2% low.
Frequency v. Tension