Sources of conductivity data – PASCO CI-6729 (1X) CONDUCTIVITY SENSOR User Manual
Page 31
27
012–06485B
Conductivity Sensor
Sources of Conductivity Data
1. International Critical Tables, Vol. VI, 230–258; McGraw Hill,
1929.
2. Handbook of Chemistry and Physics, 78th Edition; CRC Press,
1997.
3. Electrolyte Solutions, Robinson and Stokes: Butterworths, 1959.
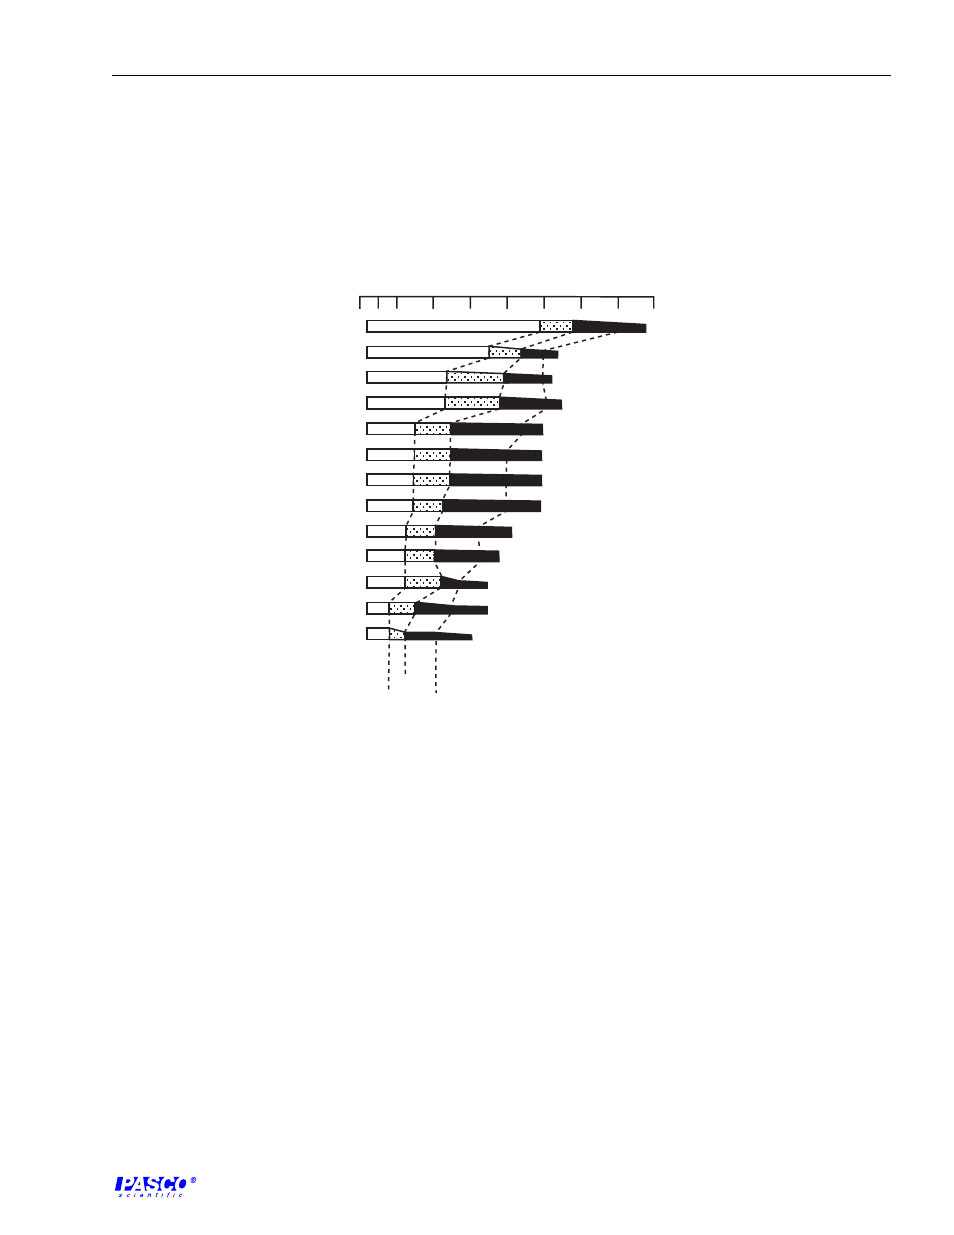
TDS (mg/l)
EC in Millimhos
per cm. at 25ûC
Beets
Spinach
Tomato
Broccoli
Cabbage
Potato
Corn
Sweetpotato
Lettuce
Bell pepper
Onion
Carrot
Beans
500
1000
2000
3000
4000
5000
6000
7000
8000
10%
25%
50%
The indicated salt tolerances
apply to the period of rapid plant
growth and maturation, from the
late seeding stage onward.
Crops in each category are
ranked in order of decreasing
salt tolerance. Width of the bar
next to each crop indicates the
effect of increasing salinity on
yield. Crosslines are placed at
10, 25, and 50% yield reductions.
Table 6 —Sample Illustrating the Application of Conductivity to Agriculture*
*From:
Environmental Chemistry: Air and Water Pollution (2nd ed.) H. Stephen Stover and Spencer L. Seager (Scott,
Foresman, and Company, Glenview, Illinois) p. 133, 1976.