PASCO CI-6729 (1X) CONDUCTIVITY SENSOR User Manual
Page 25
21
012–06485B
Conductivity Sensor
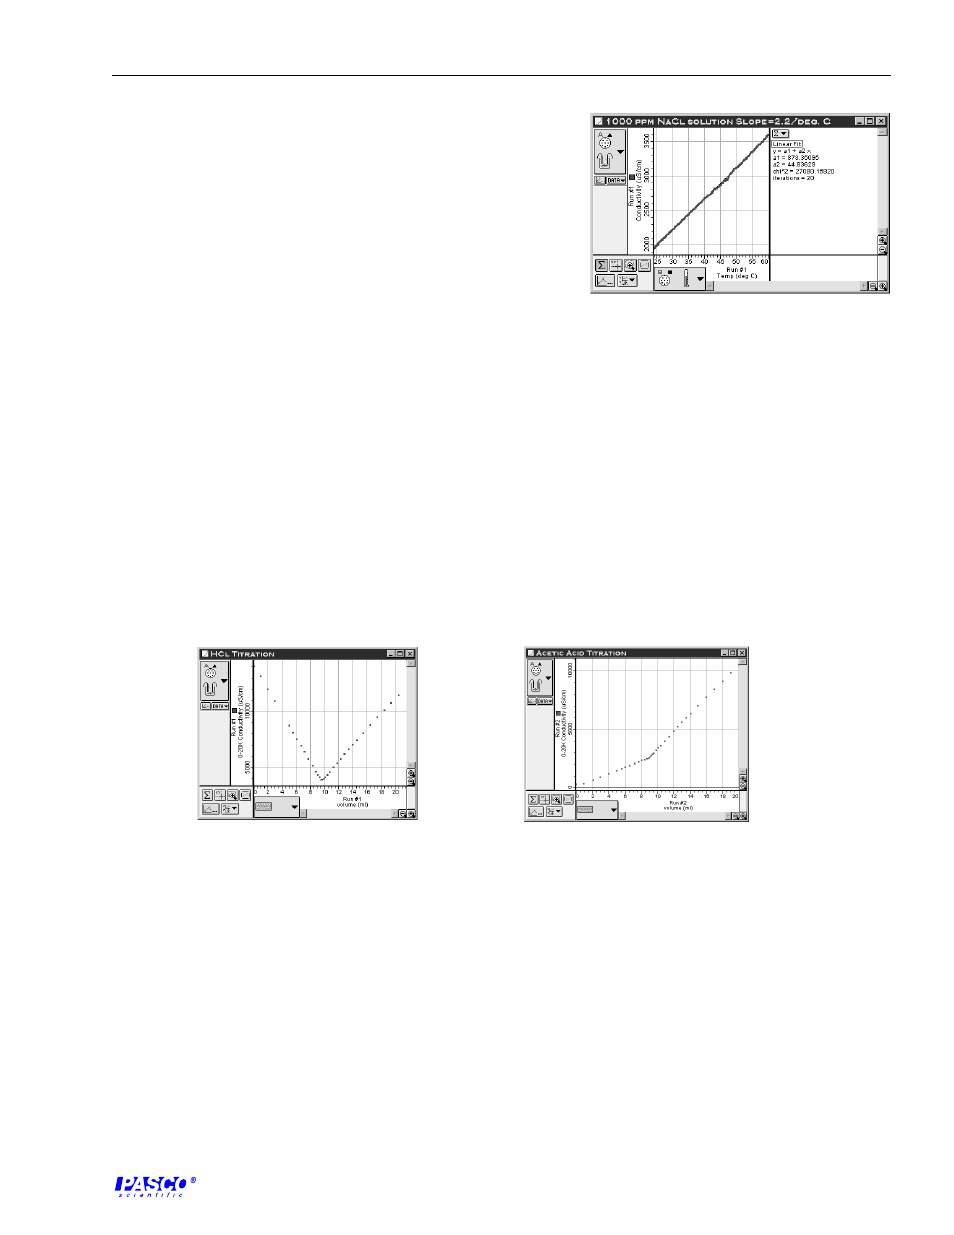
1. The conductivity increases linearly with temperature over
the observed temperature region.
2. The slopes are approximately equal for all the solutions.
3. Temperature, concentration, and solubility will effect the
conductivity of a solution.
Notes on Experiment 4
1. It is important that the student take great care in titrating
Figure TG-2
Typical experimental results
the solution near the equivalence point. Then students will easily see the discontinuity in the
conductivity (
κ) vs. Volume of titrant added graph. Typical data sets are shown in Figure
TG-3.
2. In more advanced courses the teacher can modify this experiment so that the student can
calculate the molarity of an HCl solution whose concentration is unknown.
3. As usual, the teacher should instruct students on the dangers of acids and bases, and their
Figure TG-3
Typcial experimental results
proper disposal.
Answers to Questions
1. The equivalence point is easily determined by observing the point where the slope of the line
of Concentration vs. Volume of added titrant changes.
2. Students should find that about 9 ml of titrant must be added to the acid solution to reach the
equivalence point.