Atec Rohde-Schwarz-ESU-40 User Manual
Page 10
10 R&S
®
ESU EMI Test Receiver
Version 02.00, October 2007
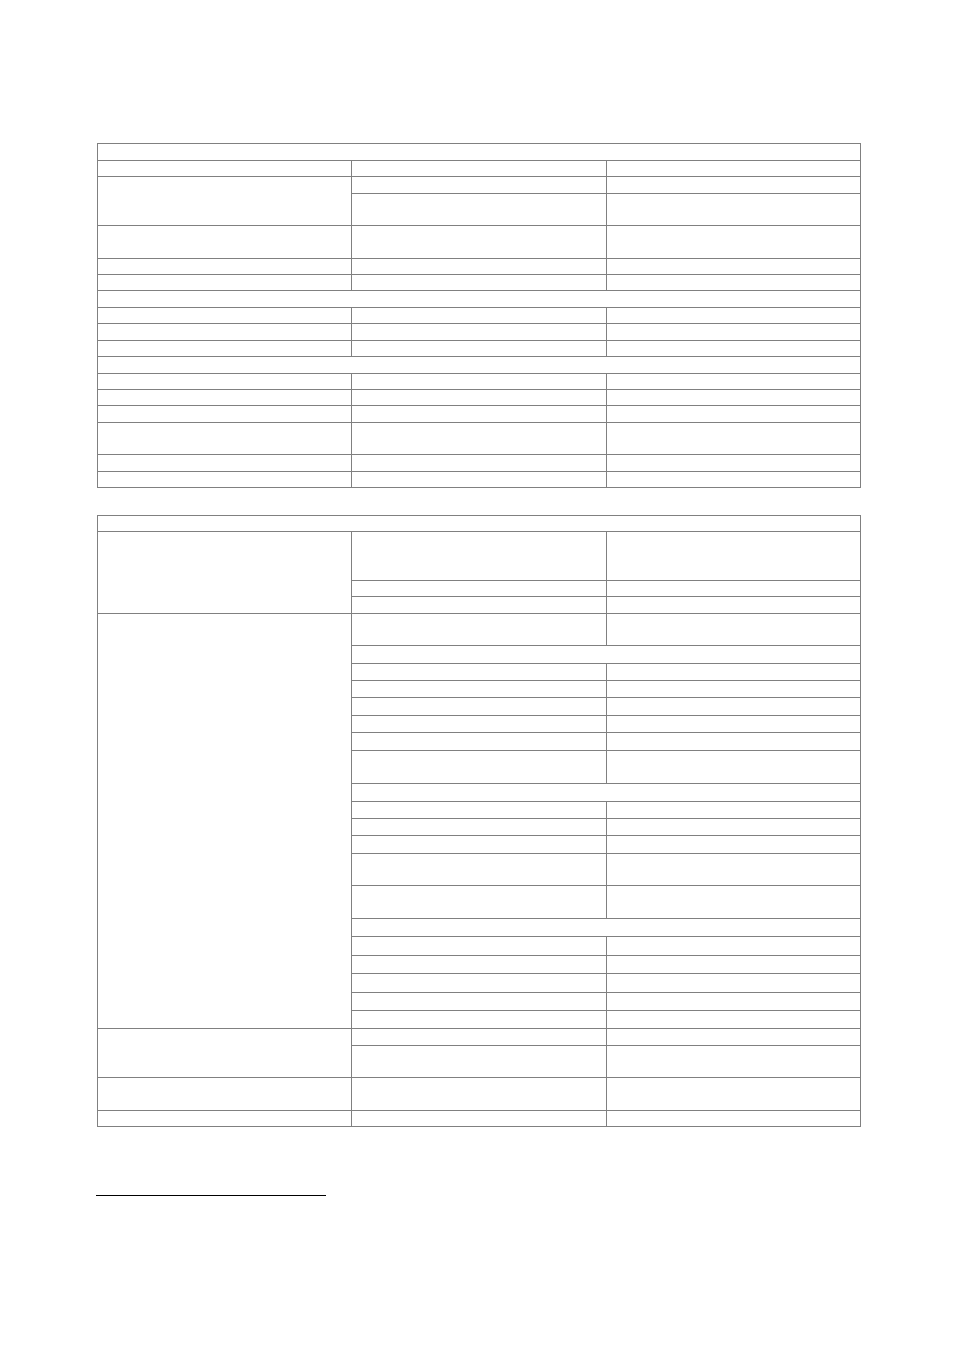
Level display (receiver mode)
Screen
625 x 500 pixels, max. 2 diagrams
analog
numeric; 0.01 dB resolution
Level display
digital
bargraph display, separately for each
detector
Detectors
max. 3 selectable
max peak, min peak, RMS, average,
CISPR-AV, CISPR-RMS, quasi peak
Measurement time
selectable
5 µs to 100 s
Units of level axis
logarithmic level display
dBm, dBµV, dBmV, dBµA, dBpW, dBpT
RF spectrum
Logarithmic level axis
10 dB to 200 dB, in steps of 10
Frequency axis
selectable
linear or logarithmic
Number of traces
3
IF spectrum
Span
selectable
1 kHz to 10 MHz, depending on RBW
Resolution bandwidth
selectable
10 Hz to 100 kHz
Detector
sample
Logarithmic level axis
80 dB to 120 dB, depending on RBW,
selectable 10 dB to 200 dB
Frequency axis
linear
Number of traces
3
Level measurement uncertainty
RBW = 10 kHz, level –30 dBm,
reference level –30 dBm,
RF attenuation 10 dB
preselection = OFF, preamplifier = OFF
2
<0.2 dB (σ = 0.07 dB)
Absolute level uncertainty at 128 MHz
preselection/preamplifier = ON
<0.3 dB (σ = 0.1 dB)
DC coupling, RF attenuation ≥10 dB,
preselection= OFF, preamplifier = OFF
2
+20 °C to +30 °C
20 Hz to 10 MHz
<0.5 dB (σ = 0.16 dB)
10 MHz ≤ f < 2 GHz
<0.3 dB (σ = 0.1 dB)
2 GHz ≤ f < 3.6 GHz
<0.5 dB (σ = 0.16 dB)
3.6 GHz ≤ f < 8 GHz, span < 1 GHz
<1.5 dB (σ = 0.5 dB)
8 GHz ≤ f ≤ 40 GHz, span < 1 GHz
<2 dB (σ = 0.7 dB)
RF attenuation > 40 dB or
f ≥ 3.6 GHz, span ≥ 1 GHz
add 0.5 dB to above values
+5 °C to +45 °C
20 Hz ≤ f < 3.6 GHz
<0.6 dB (σ = 0.2 dB)
3.6 GHz ≤ f < 26.5 GHz
add 0.5 dB to above values
f ≥ 26.5 GHz
add 1.0 dB to above values
RF attenuation > 40 dB or
f ≥ 3.6 GHz, span ≥ 1 GHz
add 0.5 dB to above values
DC coupling, RF attenuation ≥10 dB,
preselection/preamplifier = ON
+20 °C to +30 °C
20 Hz to 10 MHz
<0.8 dB (σ = 0.26 dB)
10 MHz ≤ f < 2 GHz
<0.6 dB (σ = 0.2 dB)
2 GHz ≤ f ≤ 3.6 GHz
<0.8 dB (σ = 0.26 dB)
+5 °C to
≤ +45 °C
Frequency response
referenced to 128 MHz
20 Hz ≤ f ≤ 3.6 GHz
<0.9 dB (σ = 0.26 dB)
f = 128 MHz
<0.2 dB (σ = 0.07 dB)
Attenuator switching uncertainty
0 dB to 70 dB, referenced to 10 dB
attenuation
Uncertainty of reference level setting
RF attenuation 10 dB, referenced to
–10 dBm reference level setting
<0.15 dB (σ = 0.05 dB)
Quasi-peak display
in line with CISPR 16-1
2
Only available in analyzer mode.