4 user calibration, Section 4.2.4), Section 4.2.4 – Xylem IQ SensorNet ViSolid 700 IQ (SW) User Manual
Page 35
ViSolid
®
700 IQ (SW)
Measuring
4 - 7
ba76040e02
07/2013
4.2.4
User calibration
The displayed values of total suspended solids are calculated with the
aid of the stored calibration data. In the mg/l TSS measuring mode, the
value mg/l SiO2 marked with "#" is displayed as the secondary
measured value.
The determination of the calibration value pairs is carried out by
reference measurements according to an independent procedure. At
the point of time of the calibration, the measuring medium should be in
a state representative of the later measurement (type and amount of
total suspended solids, coloration, etc.). The results from the calibration
are manually entered in the setting table of the ViSolid
®
700 IQ (SW).
Effect of the
measurement
environment on the
graph of the value pairs
TSS (laboratory) - SiO2
(ViSolid
®
700 IQ (SW))
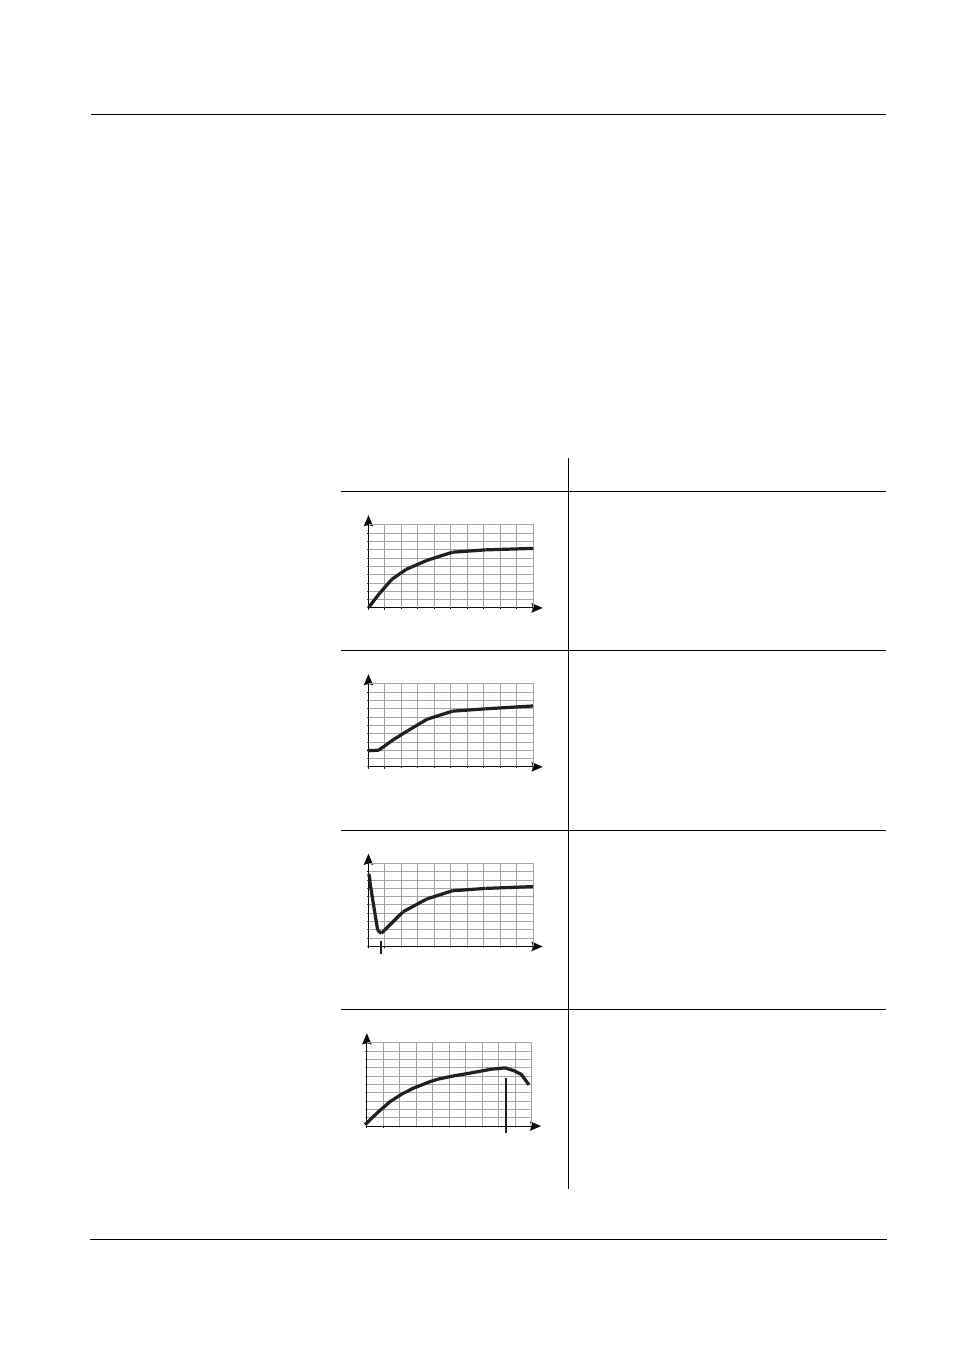
Graphs of the value pairs
Explanations
Form 1:
The graph has a gradient > 0 at every
point.
A calibration is possible for the whole
range.
Form 2:
The graph has a gradient > 0 at every
point.
At very low levels of TSS, the effect of
the measurement environment leads
to slightly increased values of SiO2.
A calibration is possible for the whole
range.
Form 3:
The graph has a gradient < 0 in the
range of smaller levels of TSS.
The effect of the measurement
environment leads to greatly increased
values of SiO2 in the range of smaller
TSS below the point (A). A calibration
is only possible in the range TSS > A.
Form 4:
The graph has a gradient < 0 in the
range of greater levels of total
suspended solids.
A calibration for matrix type 1 is only
possible in the range of TSS < B.
For measurements in the range of
TSS > B, select matrix type 2.
SiO2
[mg/l]
TSS [mg/l]
SiO2
[mg/l ]
TSS [mg/l]
SiO2
[mg/l ]
TSS [mg/l]
A
SiO2 [mg/l]
TSS [mg/l] B