Kbvw006a0b series sixteenth-brick power modules, Data sheet, Characteristic curves – GE Industrial Solutions KBVW006A0B Series User Manual
Page 5
GE
Data Sheet
KBVW006A0B Series Sixteenth-Brick Power Modules
36–75Vdc Input; 12.0Vdc Output; 6A Output Current
July 9, 2013
©2012 General Electric Company. All rights reserved.
Page 5
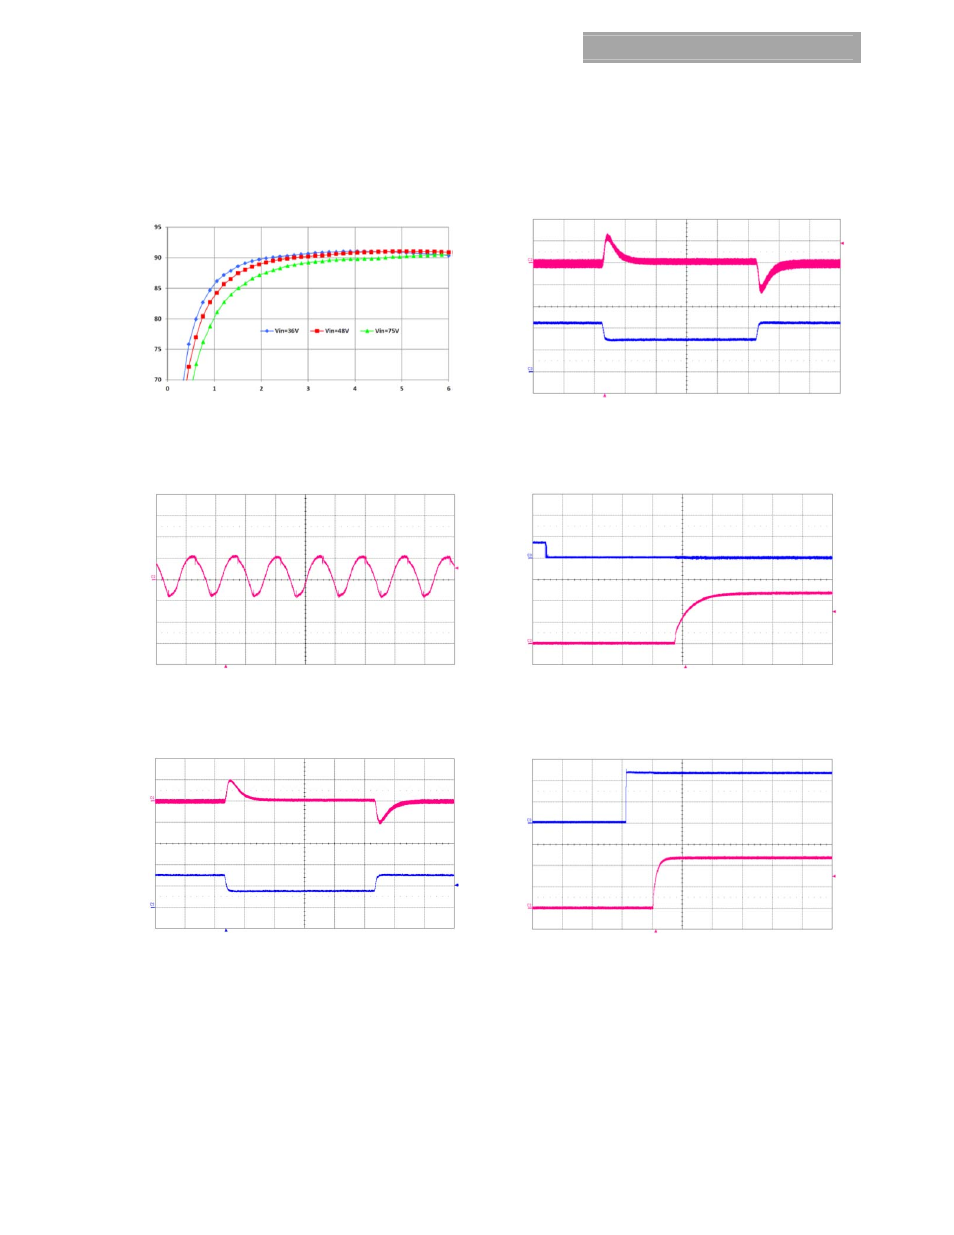
Characteristic Curves
The following figures provide typical characteristics for the module at 25
o
C. The figures are identical for either positive or negative
remote On/Off logic.
EFFIC
IENCY,
(
%
)
O
U
TPU
T
CU
RR
EN
T
O
U
TPU
T
VO
LTA
G
E
I
o(
A) (2A
/d
iv
)
V
O
(V
) (
20
0m
V/
di
v)
OUTPUT CURRENT, I
O
(A)
TIME, t (200µs/div)
Figure 1. Converter Efficiency versus Output Current.
Figure 4. Transient Response to 0.1A/µS Dynamic Load Change
from 50% to 75% to 50% of full load, Vin=48V.
OUT
PU
T V
O
LT
AGE
V
O
(V
) (5
0m
V/
di
v)
OUT
PU
T
VO
LT
AG
E
On/
O
ff
VO
LT
AG
E
V
O
(V
) (
5V
/d
iv
)
V
On
/Off
(V
) (5
V/
di
v)
TIME, t (2s/div)
TIME, t (5ms/div)
Figure 2. Typical output ripple and noise (I
o
= I
o,max
).
Figure 5. Typical Start-up Using Remote On/Off, negative logic
version shown (V
IN
= 48V, I
o
= I
o,max
).
OUTPUT
CU
RR
EN
T
OU
TP
U
T V
O
LT
AGE
I
o(A
) (
2A
/d
iv)
V
O
(V) (200
mV/d
iv
)
O
U
TPU
T
VO
LTAGE
I
N
PU
T VO
LT
AG
E
V
O
(V
) (
5V
/di
v)
V
IN
(V
) (2
0V
/d
iv
)
TIME, t (200µs/div)
TIME, t (20ms/div)
Figure 3. Transient Response to 0.1A/µS
Dynamic Load
Change from 25% to 50% to 25% of full load, Vin=48V.
Figure 6. Typical Start-up Using Input Voltage (V
IN
= 48V, I
o
=
I
o,max
).