Characteristic curves – GE Industrial Solutions 12V Mega TLynx User Manual
Page 5
Data Sheet
May 4, 2012
12V Mega TLynx
TM
: Non-Isolated DC-DC Power Modules:
6.0 – 14Vdc Input; 0.8Vdc to 3.63Vdc Output; 30A output
current
LINEAGE
POWER
5
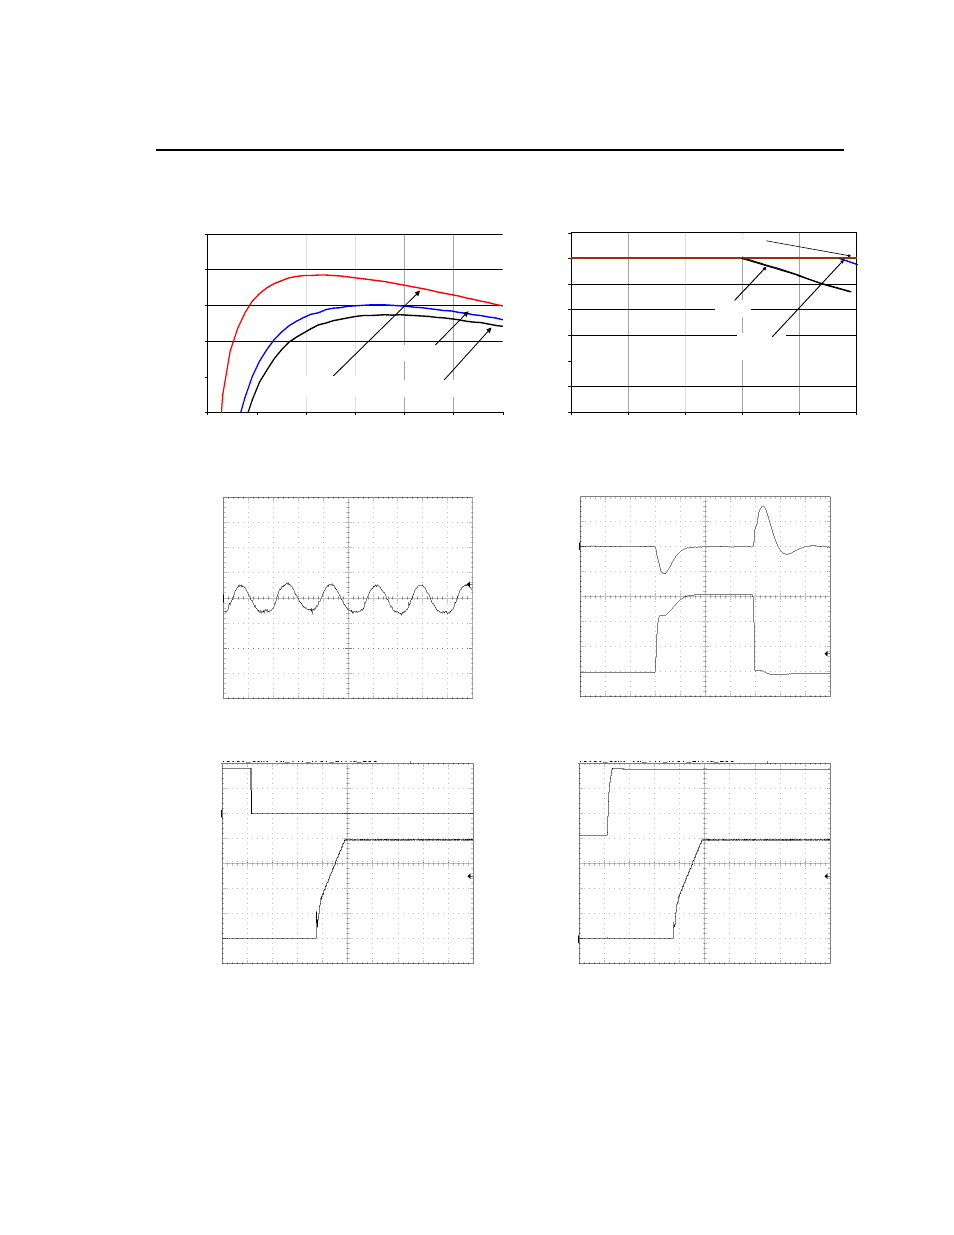
Characteristic Curves
The following figures provide typical characteristics for the APTS030A0X3-SRPHZ at 0.8V out and 25
o
C.
EF
FI
CI
EN
C
Y
, η
(%)
70
75
80
85
90
95
0
5
10
15
20
25
30
Vin=14V
Vin=6V
Vin=12V
OUTPUT
CURR
E
N
T
, I
o
(A
)
0
5
10
15
20
25
30
35
35
45
55
65
75
85
0.5m/s
(100LFM)
1m/s
(200LFM)
NC
OUTPUT CURRENT, I
O
(A)
AMBIENT TEMPERATURE, T
A
O
C
Figure 1. Converter Efficiency versus Output Current.
Figure 4. Derating Output Current versus Ambient
Temperature and Airflow at 12V in.
O
U
T
P
U
T
VOLTAGE
V
O
(V
) (2
0m
V
/d
iv
)
OUT
P
UT
CU
RR
ENT
,
OUTPU
T
VO
LT
A
G
E
I
O
(
A
)
(5
Adi
v)
V
O
(V
) (2
00
mV
/d
iv
)
TIME, t (1
μs/div)
TIME, t (20
μs /div)
Figure 2. Typical output ripple and noise (V
IN
= 12V, I
o
=
30A,
C
OUT
= 0.1μF // 47 μF ceramic capacitors ).
Figure 5. Transient Response to Dynamic Load
Change from 0% to 50% to 0% with V
IN
=12V.
O
U
TP
U
T
V
O
L
T
A
G
E
O
N
/O
FF
VOLTAG
E
V
O
(V
) (2
00
mV/d
iv
)
V
ON
/O
F
F
(V
)
(5
V
/d
iv)
O
U
T
P
UT
V
O
LT
A
G
E
IN
P
U
T
V
O
LT
A
G
E
V
O
(V
) (2
00
mV/d
iv
)
V
IN
(V)
(5V/
di
v)
TIME, t (2ms/div)
TIME, t (2ms/div)
Figure 3. Typical Start-up Using On/Off Voltage (I
o
=
I
o,max
).
Figure 6. Typical Start-up Using Input Voltage (VIN =
14V, Io = Io,max).