3 packet statistics, Figure 35 packet statistics, Table 18 packet statistics – ZyXEL Communications P-2602R-DxA Series User Manual
Page 77: Section 6.3 on
P-2602R/RL-DxA Series User’s Guide
Chapter 6 Status Screens
77
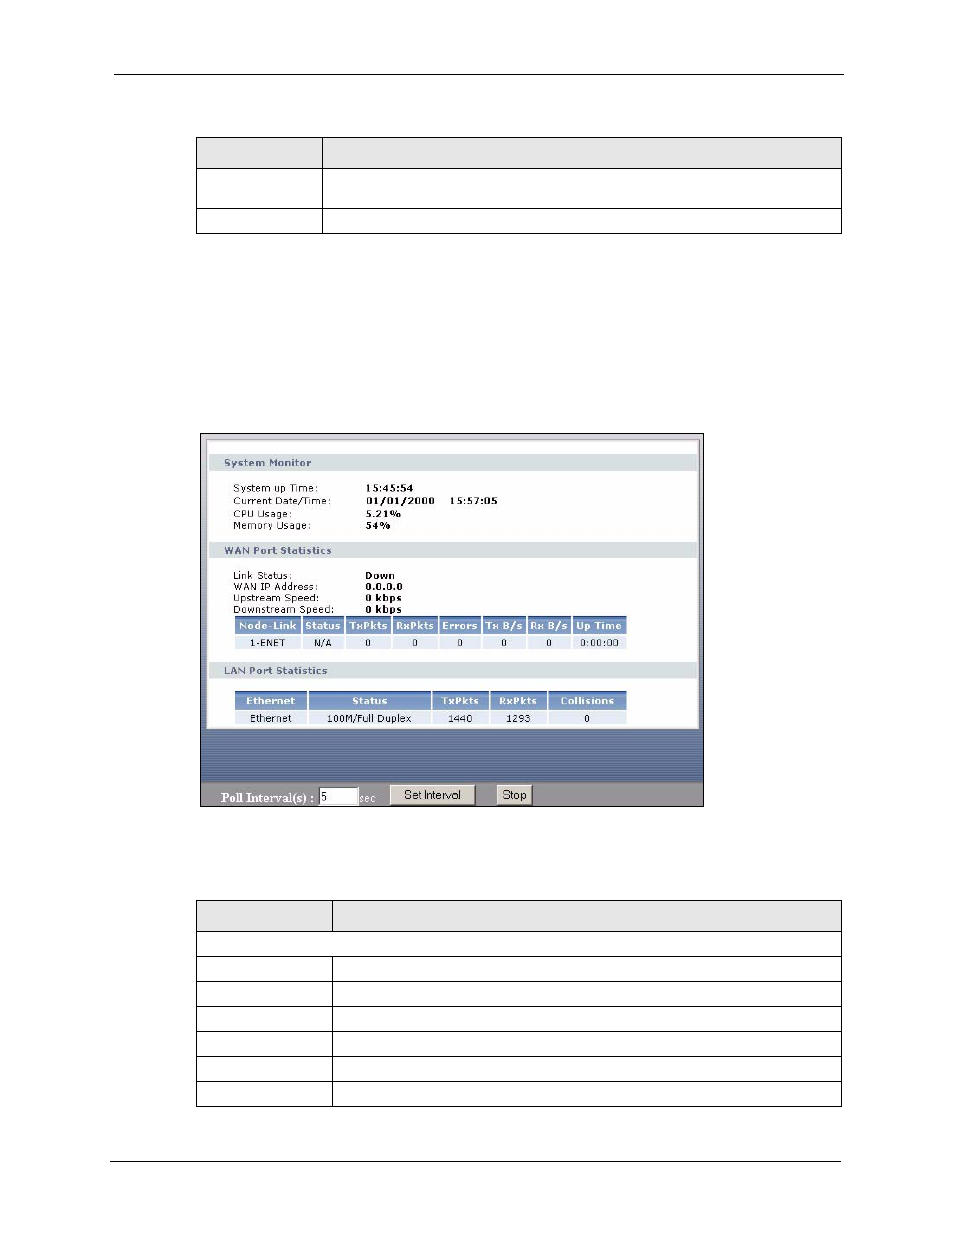
6.3 Packet Statistics
Click Status > Packet Statistics to access this screen. Read-only information here includes
port status and packet specific statistics. Also provided are "system up time" and "poll
interval(s)". The Poll Interval(s) field is configurable.
Figure 35 Packet Statistics
The following table describes the fields in this screen.
MAC Address
This field displays the MAC address of the computer that is using the ZyXEL
Device but is in a different subnet than the ZyXEL Device.
Refresh
Click this to update this screen.
Table 17 Any IP Table
LABEL
DESCRIPTION
Table 18 Packet Statistics
LABEL
DESCRIPTION
System Monitor
System up Time
This is the elapsed time the system has been up.
Current Date/Time
This field displays your ZyXEL Device’s present
date and time.
CPU Usage
This field specifies the percentage of CPU utilization.
Memory Usage
This field specifies the percentage of memory utilization.
WAN Port Statistics
Link Status
This is the status of your WAN link.