Capture graph tab – Network Instruments GigaStor 114ff User Manual
Page 69
Configuring the GigaStor through the Control Panel
Chapter 4 GigaStor Control Panel
69
rev. 1
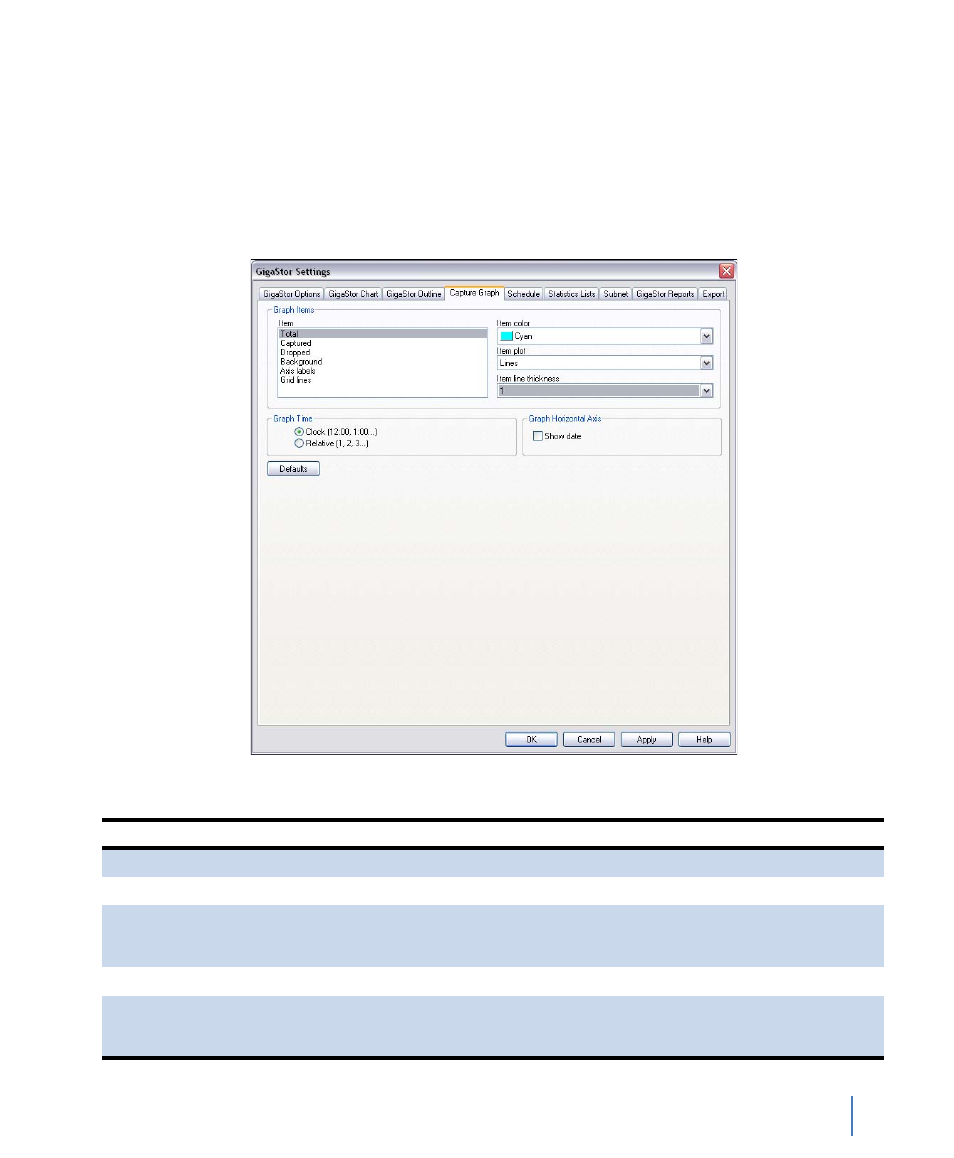
Capture Graph tab
Click Settings and the tab for the type of graph or chart for which you
want to set the display properties. Follow the instructions in
“Configuring the GigaStor through the Control Panel” on page 63 to
open the Capture Graph tab (Figure 42).
Figure 42 Capture Graph tab
Table 6 Capture Graph fields
Field
Description
Item
allows you to select which item will be configured.
Item color
allows you to select the color of the display item.
Item plot
allows you to select the item to be displayed as Lines or Bars. This
dropdown will only be active if “Lines” is selected in the “Item plot”
dropdown.
Item line thickness
allows you to select the thickness of the displayed item (in pixels).
Graph Time option buttons
allows you to set how the “X” axis will be displayed. Clock time will
show times using a 24-hour clock (i.e., the current time). Relative
time will display times from the start of the activation of the mode.