John Deere SURFACE WATER PRO OMPFP11362 User Manual
Page 24
Satellite Information
JS56696,0000A07 1902JUN113/3
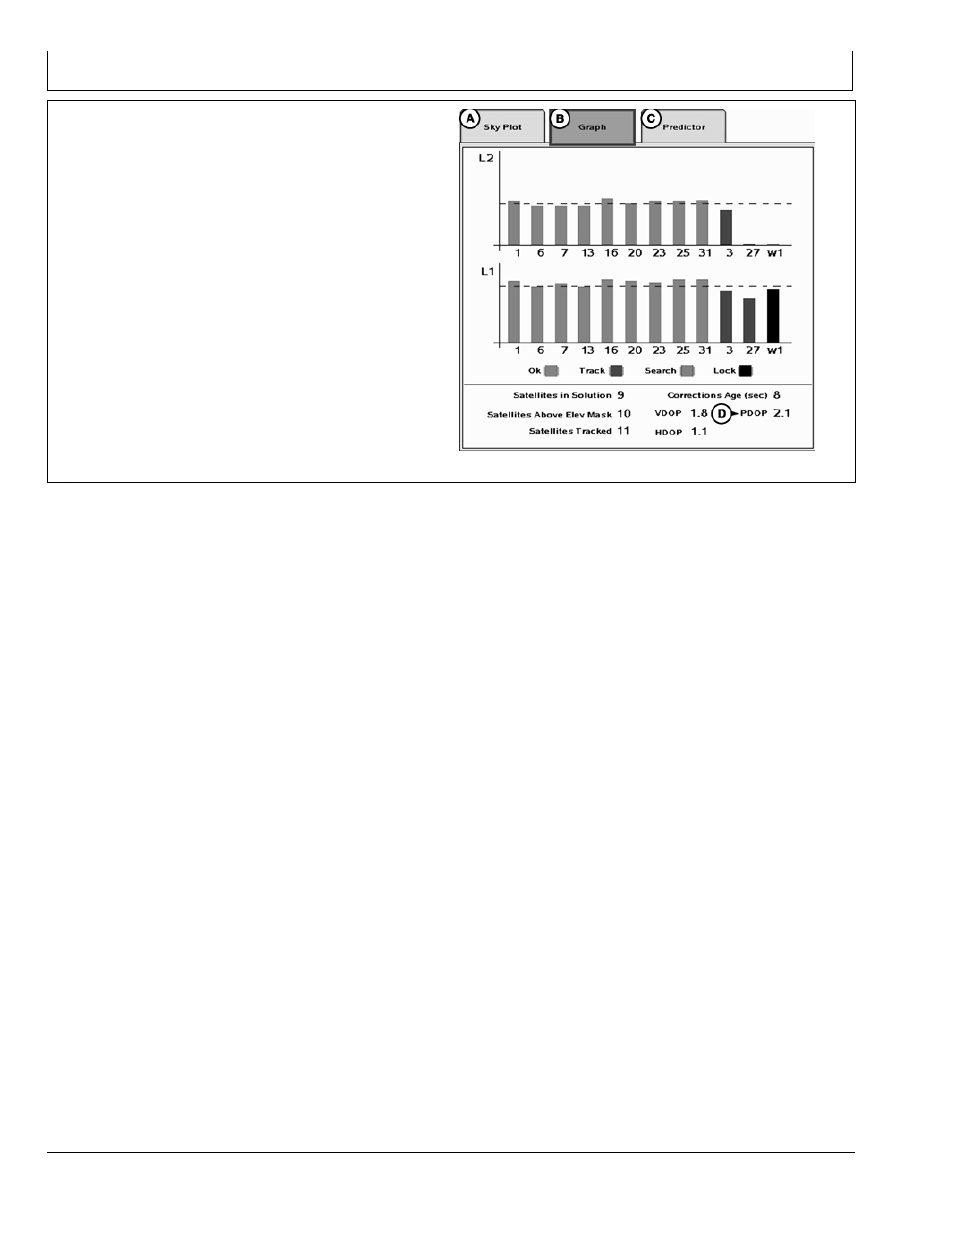
Graph
A graph illustrating L1 and L2 SNR values.
•
Bars are colored to satellites current status.
•
SNR values (colored bar) should be above dashed line
that runs horizontally across bar graph.
NOTE: Only GREEN bars are used in calculation of
PDOP, VDOP, AND HDOP. SNR’s are considered
good if above dashed line.
A—SkyPlot tab
B—Graph tab
C—Predictor tab
D—PDOP
PC13704
—UN—12MA
Y1
1
203
061611
PN=24
See also other documents in the category John Deere Gardening equipment:
- LA145 (52 pages)
- X300 (2 pages)
- LA145 (1 page)
- 318 (440 pages)
- z425 (48 pages)
- LA115 (1 page)
- 75C (6 pages)
- OMGX20927 (28 pages)
- 50C ZTS (8 pages)
- OMM141979 J9 (36 pages)
- 5303 (16 pages)
- 850C LGP (5 pages)
- 435C (2 pages)
- 4520 (12 pages)
- 125 (11 pages)
- 310SE (5 pages)
- 410J TMC (40 pages)
- 5083EN (1394 pages)
- PrecisionCut 8700 (16 pages)
- HLOADERS 624H WH (10 pages)
- J BACKHOES 310SJ (40 pages)
- 850J (16 pages)
- 717 Z-TRAK (12 pages)
- 1050J (20 pages)
- PrecisionCut 7200 (16 pages)
- 315SJ (6 pages)
- Select Series X520 (2 pages)
- Greens 180C (8 pages)
- AUTOTRAC OMPFP11320 (72 pages)
- 5204 (194 pages)
- 544J WH (5 pages)
- 244J (18 pages)
- D-SERIES 319D (20 pages)
- GREENSTAR BZ13788 (30 pages)
- POWERTECH 6068 (250 pages)
- 550H LGP (5 pages)
- 495D (3 pages)
- DM1150 (4 pages)
- Ultimate X720 (2 pages)
- 6300 (2 pages)
- 225D LC (24 pages)
- 544J (32 pages)
- 315 (2 pages)
- GT2554 (56 pages)
- 20 (4 pages)