3 gas curves – LumaSense Technologies INNOVA 1316A-2 User Manual
Page 42
Chapter 3
_________________________________________________________________________________________
_____________________________________________________________________________
BE6021-11
1316A-2 Multi Gas Monitor
LumaSense Technologies A/S
Instruction Manual
Page 42 of 97
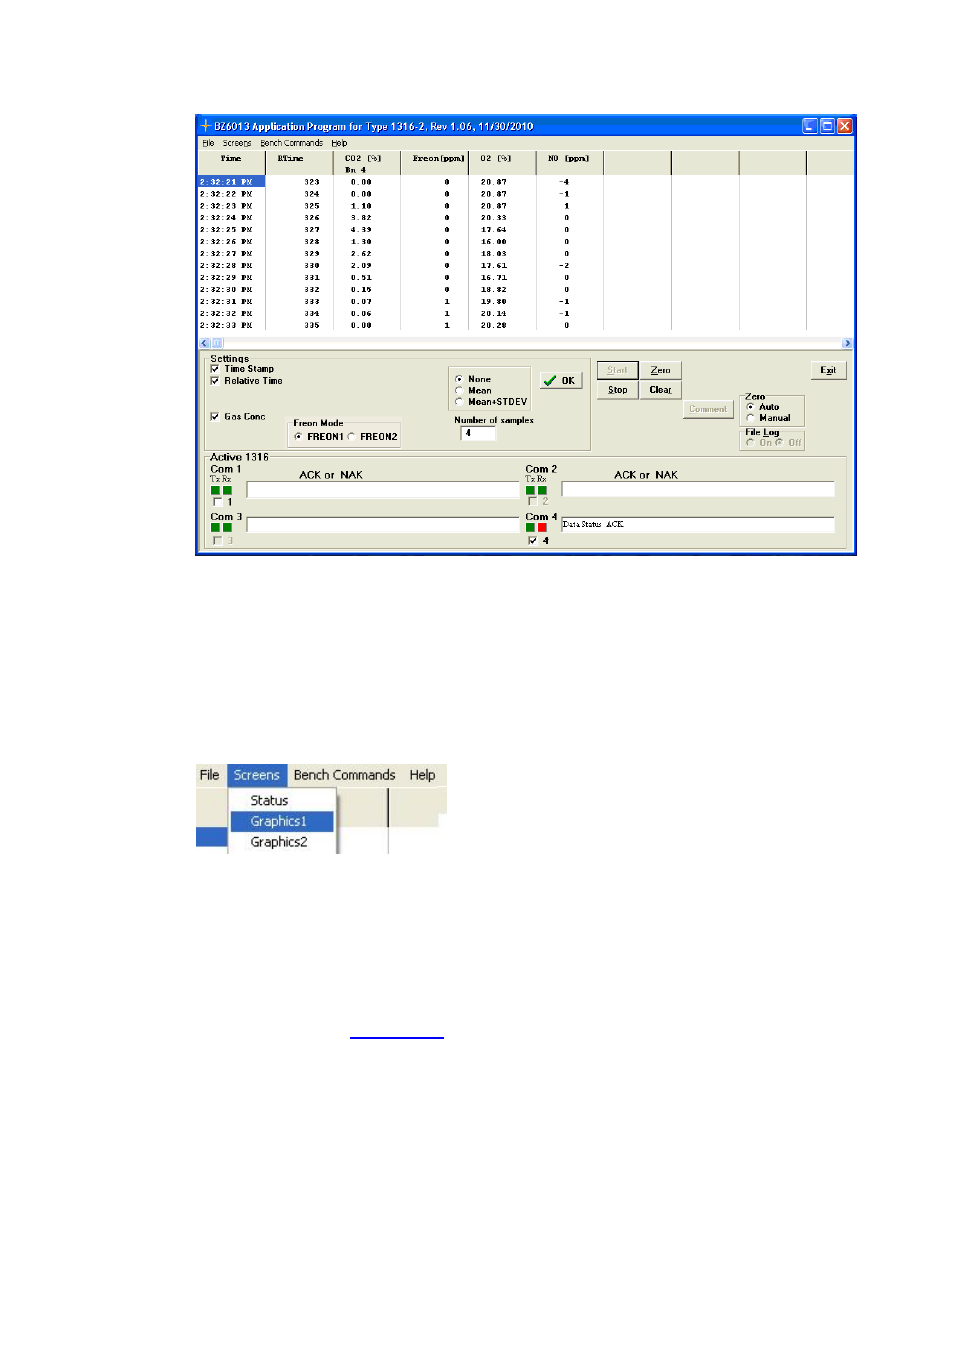
Fig.3.7. The BZ6013 Main menu screen showing Time, Relative time
and Gas Concentrations for a 1316A-2 attached to COM port 4.
3.2.3 Gas Curves
To have a graphical presentation of the measurement data Select the
Screens pull down and select either Graphics1 or Graphics2.
Graphics1.
In the Graphics 1 mode the x-axis is a time axis.
The concentrations of all gases are presented using 2 y-axis. The
primary y-axis for CO2 and O
2
in a percentage (%) scale. And the
secondary y-axis to present measurement data for Freon and NO in a
- IN 510-N (38 pages)
- M67S (52 pages)
- IGA 740-LO (28 pages)
- IGA 740 (27 pages)
- IN 3000 (4 pages)
- ISR 320 (46 pages)
- IGA 320/23-LO (44 pages)
- IGA 320 (34 pages)
- IGA 310 (21 pages)
- IS 50/067-LO plus (36 pages)
- IS 6-TV Advanced (25 pages)
- IN 6/78-L (38 pages)
- ISR 6 Advanced (50 pages)
- IGA 6/23 Advanced (46 pages)
- IGA 6 Advanced (44 pages)
- IGA 8 pro (32 pages)
- IS 12-Al (38 pages)
- IGA 12 (40 pages)
- M8100PM-EXP (78 pages)
- MCS640 Manual (26 pages)
- MCS640 Quick Start Guide (4 pages)
- MC320 Manual (32 pages)
- SpyGlass Lens ViewPort (1 page)
- MIKRON M7815 (6 pages)
- MIKRON M7816 (6 pages)
- BoilerSpection-IM Manual (43 pages)
- BoilerSpection-IM Quick Start Guide (4 pages)
- BoilerSpection-HD (90 pages)
- M390S (32 pages)
- MIKRON M345X12 (18 pages)
- M390 (35 pages)
- M330 (45 pages)
- M335 (19 pages)
- M360 (21 pages)
- M305 (19 pages)
- M300 (19 pages)
- M310 (35 pages)
- M340 (30 pages)
- INNOVA 1316A-1 (98 pages)
- INNOVA 1316A-3 (96 pages)
- INNOVA 1303 (60 pages)
- INNOVA 1412i (202 pages)
- INNOVA 1309 (42 pages)
- INNOVA 1314i (199 pages)