Viewing the memory usage of a device, Viewing the response time of a device, Viewing the unreachability rate of a device – H3C Technologies H3C Intelligent Management Center User Manual
Page 26: Viewing the interface bandwidth usage of a device
17
Viewing the memory usage of a device
Click Memory Usage for a network device to display its memory usage over the specified time range in
a line chart.
For more information, see "
Viewing the memory usage of a Lync server
Viewing the response time of a device
Click Device Response Time for a network device to display its response time over the specified time
range in a line chart.
For more information, see "
Viewing the device response time of a Lync server
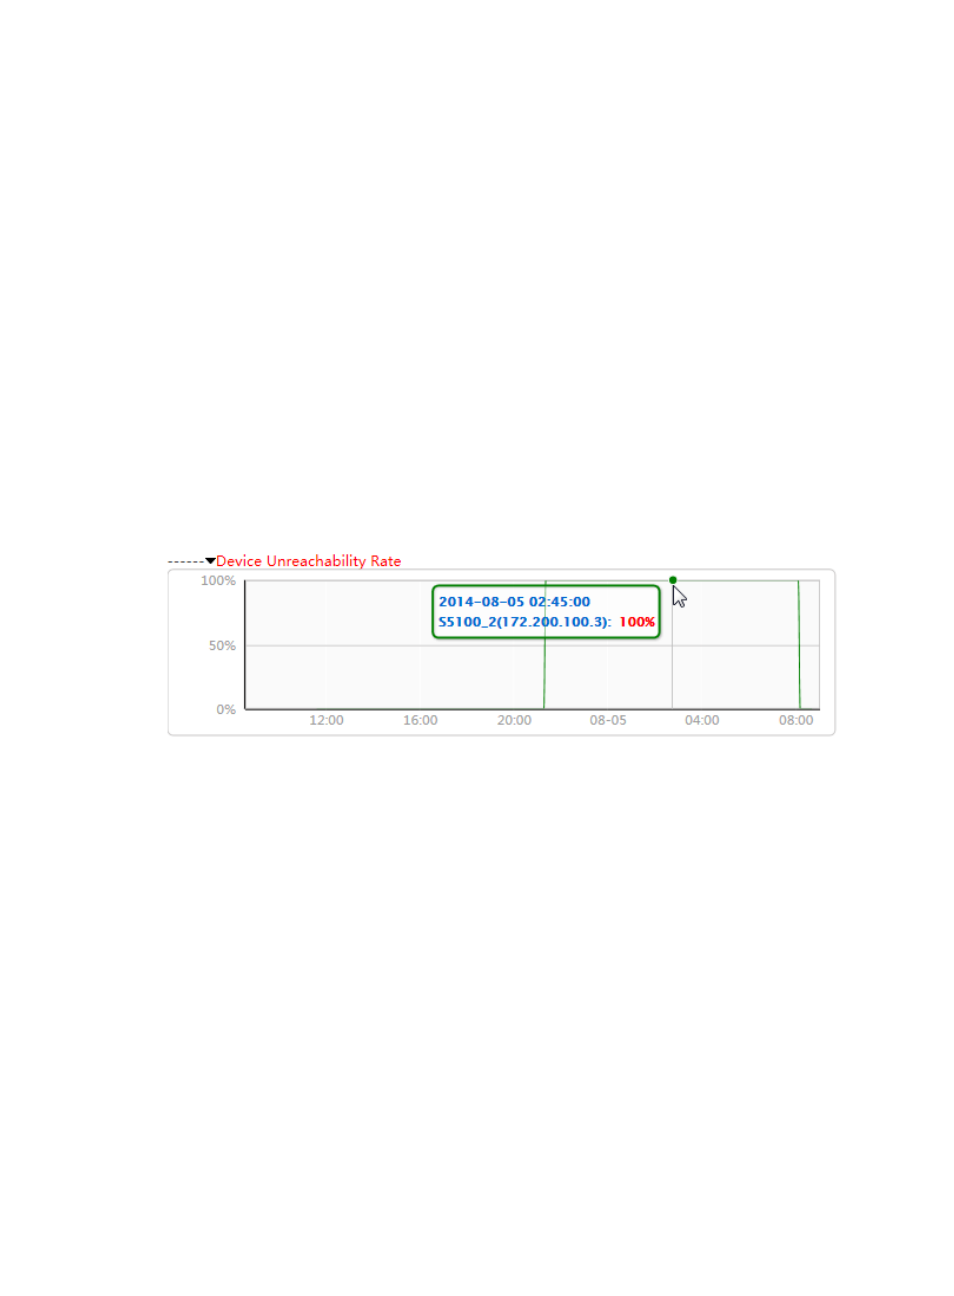
Viewing the unreachability rate of a device
Click Device Unreachability Rate for a network device to display its unreachability rate over the specified
time range in a line chart:
•
The horizontal axis represents different time points.
•
The vertical axis represents the device unreachability rate.
Move the pointer over a spot on the curve to display the device unreachability rate at the specific time
point.
Figure 17 Device Unreachability Rate line chart
Viewing the interface bandwidth usage of a device
Click Interface Bandwidth Usage for a network device to display its interface bandwidth usage over the
specified time range in a line chart:
•
The horizontal axis represents different time points.
•
The vertical axis represents the interface bandwidth usage of the device.
Move the pointer over a spot on the curve to display the interface bandwidth usage of the device at the
specific time point.
Each monitored interface on the device is represented by a line in a unique color.
Click the interface name to hide or display the bandwidth usage of the interface on the chart.