Chart – Super Systems MGA6010 User Manual
Page 12
MGA 6010 Operations Manual
Super Systems Inc.
Page 12 of 54
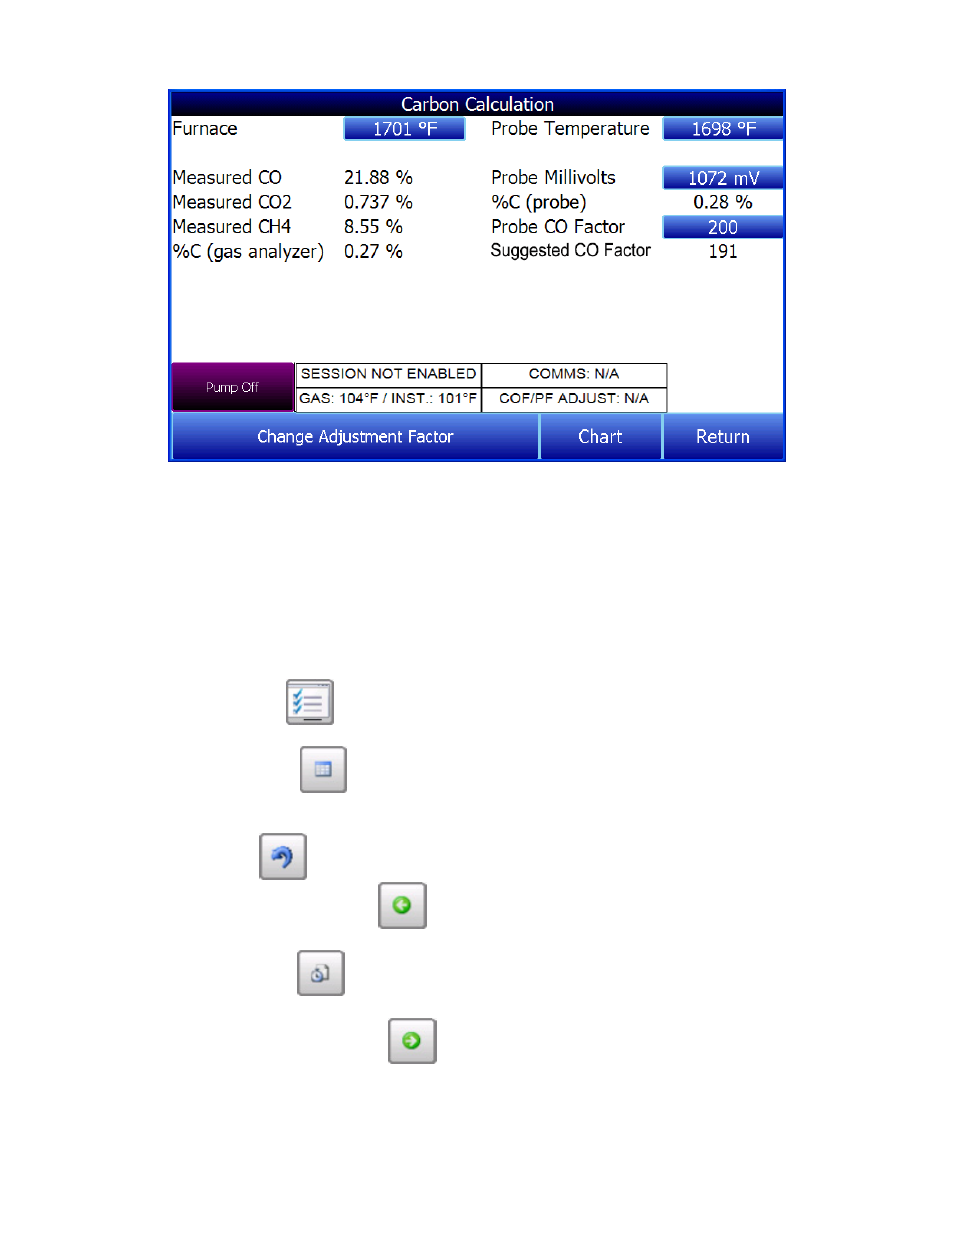
Using infra-red analysis is considered a more accurate method for determining the percent carbon of a
gas compared to using an oxygen probe alone. The single point oxygen probe assumes a theoretical
mixture of endothermic gas to infer the percent carbon whereas the gas analyzer will measure the exact
composition of the process gas. The percent carbon determined by the gas analyzer can then be used to
adjust the carbon percentage determined by the oxygen probe.
Chart
The Chart Display shows between 1 hour and 24 hours of process variable data on the screen and can be
scrolled back to view all of the data stored on the flash card. The vertical timelines change as the time
changes on the screen. The function buttons run along the bottom of the screen.
The Trend Lines button -
- will allow the user to select or de-select the trend lines on the trend
chart to display. If the checkbox next to each trend line is checked, then that trend line will be displayed.
The Datagrid View button -
- will display a screen with the trend data in a grid format instead of
with trend lines. The trend data is shown in 1-minute intervals. Clicking on the OK button on this screen
will close the screen down and return to the Chart Display screen.
The Refresh button -
- will refresh the screen’s trend data if the screen is not in real-time mode.
The left-pointing green arrow button -
- will move the chart’s view backward in time by the
specified chart interval.
The chart interval button -
- will determine the number of hours displayed on the trend chart. The
options are: 1 Hour, 2 Hours, 4 Hours, 8 Hours, 12 Hours, or 24 Hours.
The right-pointing green arrow button -
- will move the chart’s view forward in time by the
specified chart interval.