Operations, Dashboard – OpenEye SaleGuard User Manual
Page 27
27
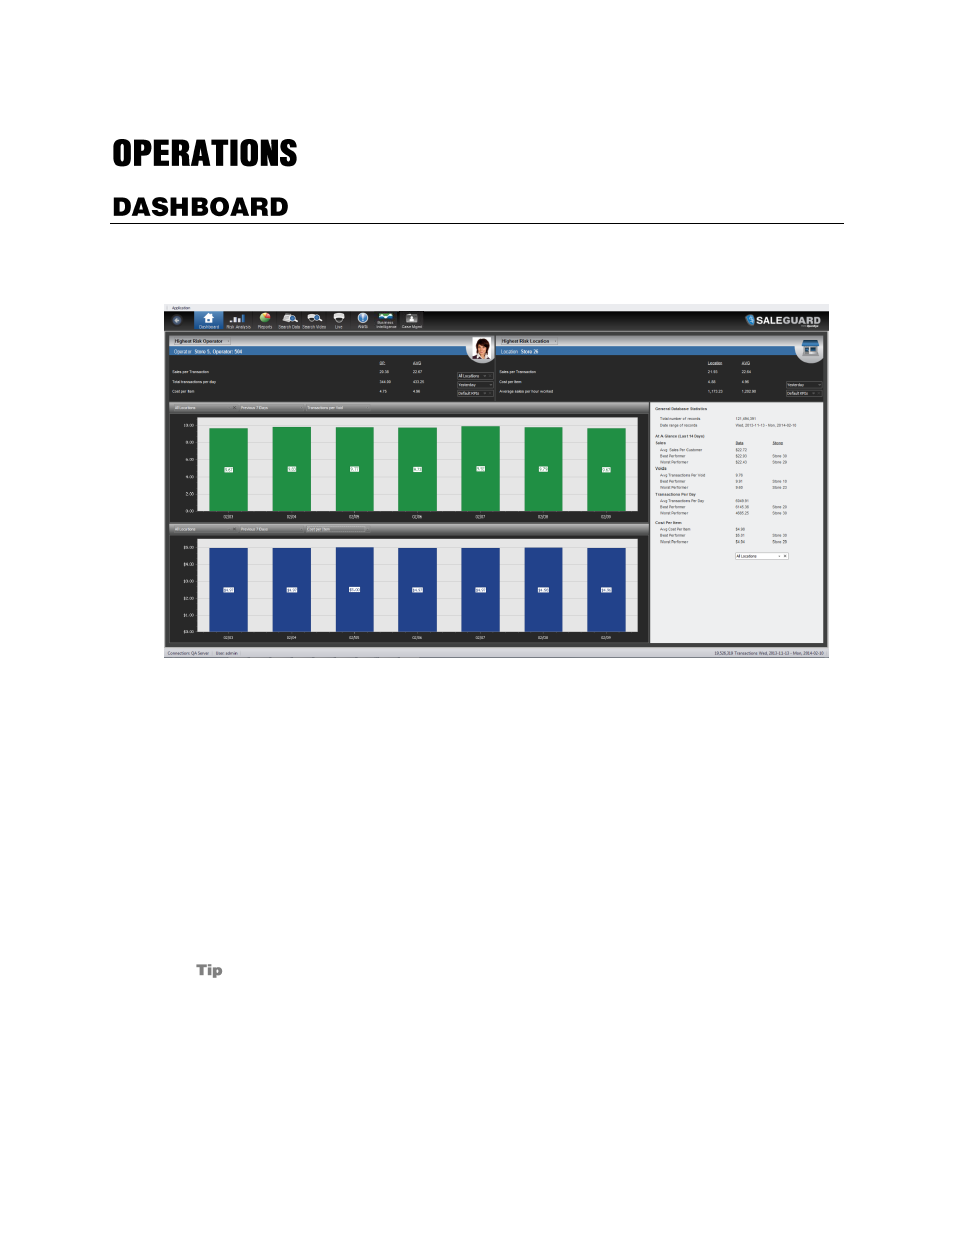
The Client Dashboard contains a quick overview of information. You can use the dashboard to quickly
access basic information.
T
h
e
D
a
s
h
b
o
a
r
d
Highest Risk Employee or Location
Find your highest risk employee at a single location or across all locations
Find your highest risk location
These can be adjusted by selecting options from the dropdown lists
Graphs
See a visual graph of transaction types or total sales for a single location or all your locations
At a Glance
The general section shows the total number of records the database contains and the date range
included
Other information includes Total Sales, Voids, No Sales, and Returns based on your best and
worst performing locations
Any changes made to the appearance of the data on the Dashboard will be saved on a per
user basis.