Ab c d – K-Patents PR-03 User Manual
Page 41
41
41
41
41
5 Startup, configuration and calibration adjustment
35
HT
Sensor head temperature sensor reading. This value is used in calculating the actual Sensor
head internal temperature.
HH
Sensor head humidity sensor reading. The actual relative humidity inside the sensor is cal-
culated from HH and HT.
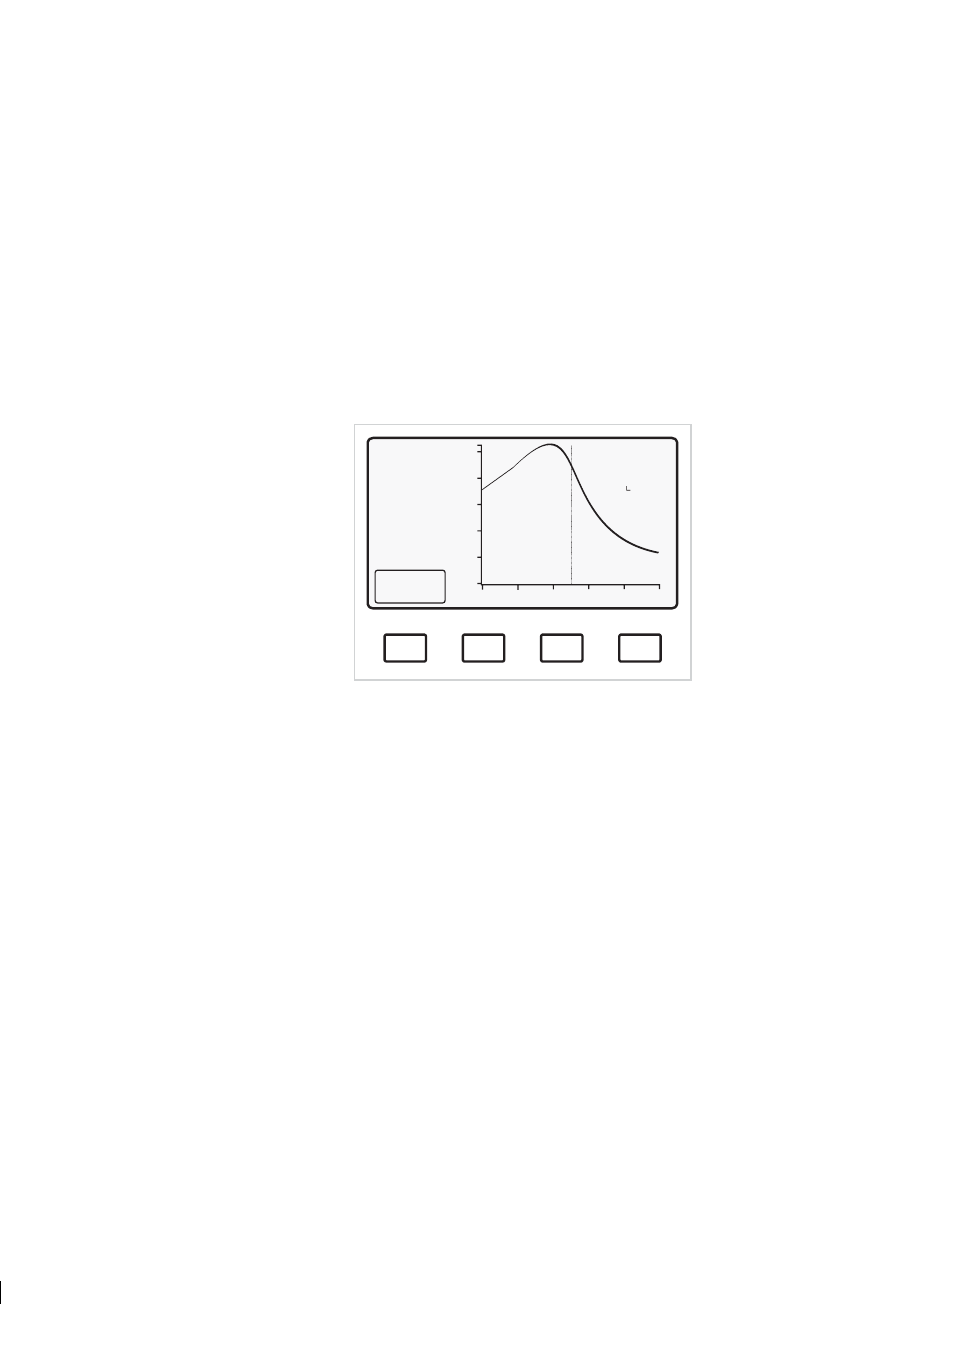
5.5.3 Viewing Scaled image
In the scaled image (Figure 5.8) the optical image has been modified mathematically to make a clearer
curve.
A
B
C
D
SCALED
OPTICAL
IMAGE
TEST: 115.9
51.2
°C
Endp: 21
L):
9.8
R):
25.9
HT: 20 °C
HH: 3%
Slope
Normal operation
Figure 5.8
Scaled image display
The Scaled image display provides following information:
TEST:
The calculated TEST value, i.e. the number of photocells on the lisght side of the optical image
(to the left fo the vertical line). Range 8–248. Indicated by a dotted vertical line.
(T)
Indicates the process temperature.
Endp:
The vertical intensity value of the rightmost point in % of span.
L):
A measure of the left side curvature of the optical image.
R(:
A measure of the right side curvature of the optical image.
A zero curvature indicates a straight line. Both curvature values are defined as positive for an
image as Figure 5.5.3.
HT:
Sensor head internal temperature in
◦
C.
HH:
Sensor head internal relative humidity in %RH.
5.5.4 Viewing slope
The Slope display (Figure 5.9) shows the slope curve of the optical image. Slope is a measure of the
sharpness of the optical image.
The SLOPE curve should have a sharp dip at the TEST value. The following additional values are given: