Rf performance – Ubiquiti Networks Rockeac User Manual
Page 12
9
Chapter 2: Main
airOS®7 User Guide
Ubiquiti Networks, Inc.
airTime TX/RX, %
Displays the transmit and receive
airtime percentage values. The airtime is the percentage
of the time the radio resource is utilized in the specified
direction (TX/RX).
Desired Priority
Displays the requested airMAX station
priority level that is configured on the Wireless page (for
details, see “airMAX Station Priority” on page 15).
Priority
(Available in Station PTMP mode only.) Displays
the current operating priority of the station.
Note:
The Priority may be lower than the
configured Desired Priority. The AP automatically
lowers the priority depending upon RF conditions
and performance.
Connection Time
Displays the total time elapsed for the
connection.
Last IP
Displays the station’s last IP address.
Action
Displays available options for this station. For
example, click Kick to drop the connection to this station.
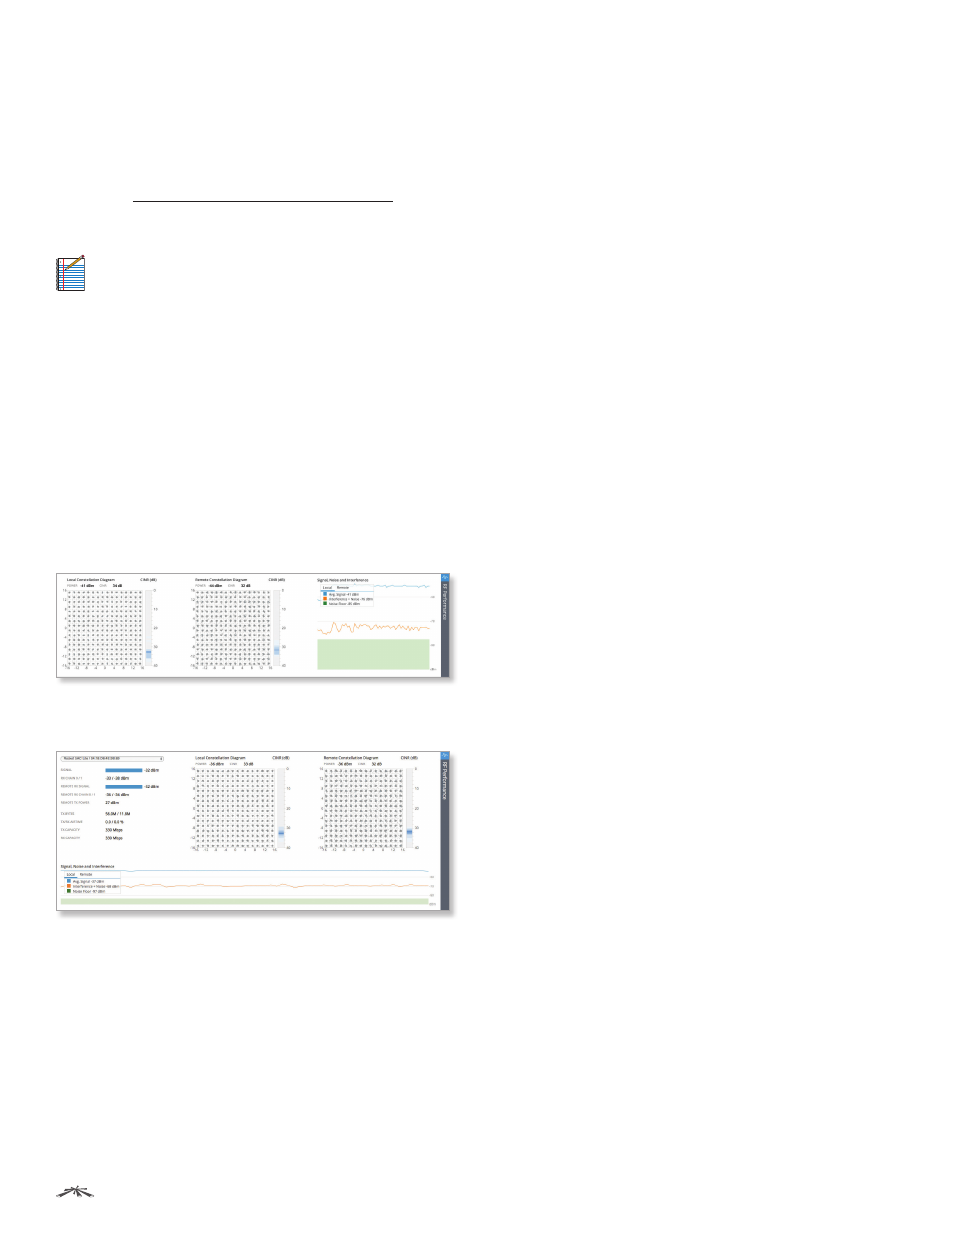
RF Performance
The RF Performance section displays persistent RF Error
Vector Magnitude (EVM) constellation diagrams, Carrier
to Interference-plus-Noise Ratio (CINR) histograms, and
Signal, Noise, and Interference time series plots:
In Access Point PTMP mode, the section also displays
information on the stations connected to the AP:
The RF Performance section contains the following
information:
Signal
(Available in Access Point PTMP mode.) Displays the
signal level in dBm.
RX Chain 0/1
(Available in Access Point PTMP mode.)
Displays the wireless signal level (in dBm) of each chain.
Remote RX Signal
(Available in Access Point PTMP mode.)
Displays the received signal level at the station in dBm.
Remote RX Chain 0/1
(Available in Access Point PTMP
mode.) Displays the wireless signal level (in dBm) of each
chain on the remote device.
Remote TX Power
The transmit power level of the
remote device.
TX Bytes
(Available in Access Point PTMP mode.) Displays
the total amount of data (in bytes) transmitted and
received by the station during the connection time.
TX/RX Airtime
(Available in Access Point PTMP mode.)
Displays the transmit and receive airtime values. The
airtime is the averaged wireless bandwidth utilization
(percentage of theoretical transmission maximum), for
both failed and successful transmission attempts.
TX Capacity
(Available in Access Point PTMP mode.)
Displays the transmit capacity, in Mbps, that the station
would have if it were the only station on the network.
RX Capacity
(Available in Access Point PTMP mode.)
Displays the receive capacity, in Mbps, that the station
would have if it were the only station connected to the AP.
Local/Remote Constellation Diagram
Provides a real-
time visual depiction of the modulation for the local or
remote device. The modulation, which can be 1x (BPSK),
2x (QPSK), 4x (16-QAM), 8x (64-QAM), or 16x (256-QAM),
adjusts dynamically as the system adapts to changing
conditions. The plotted points’ appearance indicates the
signal quality: tightly defined points indicate higher signal
quality, while diffuse points indicate lower signal quality.
CINR (dB)
These histograms display the CINR, in dB,
for the local and remote devices. The CINR is a measure
of signal quality. It is the median value of how high the
signal is over the combined interference and noise. In
each histogram, the color shows the distribution of CINR
values; the darker the color, the greater the number of
occurrences of that value.
Signal, Noise and Interference
Displays a time-based
plot of the system signal, noise, and interference levels
in dBm for both the local and remote devices. The power
and CINR levels for the local and remote devices are also
displayed above each constellation diagram.