Concentration curves – Hanna Instruments HI 720 Series User Manual
Page 25
48
49
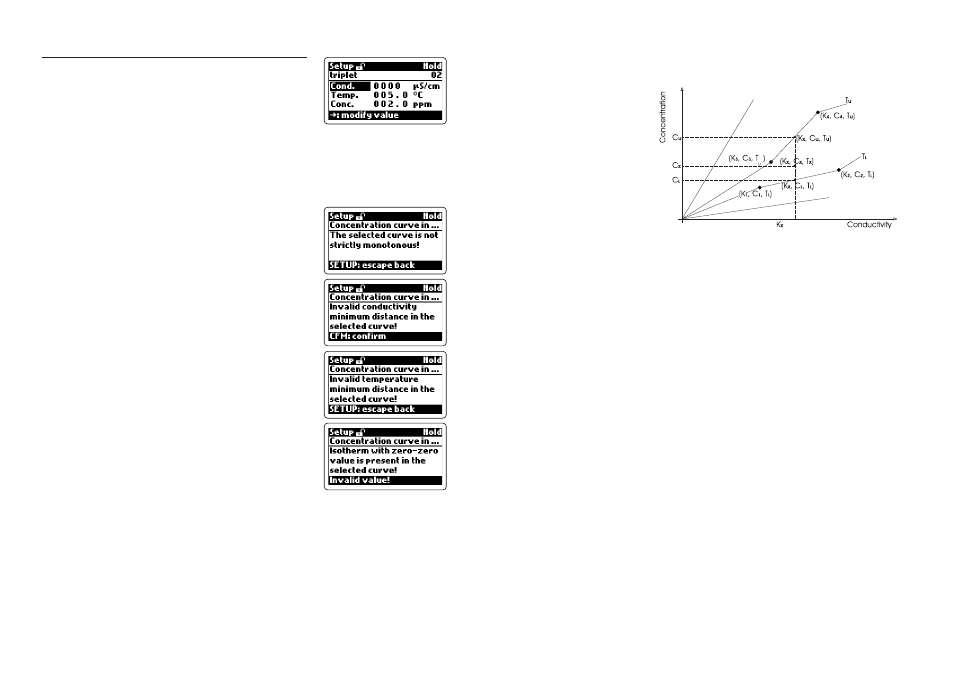
• C
U
is the concentration corresponding to the conductivity K
U
at the tempera-
ture T
U
, and T
U
is the temperature of the isotherm just above T
X
.
The diagram shows the
computational proce-
dure.
Note
If T
X
is greater than all temperature values specified for the isotherms,
then the concentration value C (K
X
, T
max
) is assigned to C
X
(where
T
max
is the maximum temperature for the selected table), and the
“Temperature out of conc. table (61)” alarm is generated.
If T
X
is lower than all temperature values specified for the isotherms,
then the concentration value C (K
X
, T
min
) is assigned to C
X
(where
T
min
is the minimum temperature for the selected table), and the “Tem-
perature out of conc. table (61)” alarm is generated.
Note
If the calculated concentration is greater or lower than all concen-
tration values specified in the table, the “Concentration out of conc.
table (63)” alarm is generated.
Note
If the conductivity is greater or lower than all conductivity values
specified in the table, the “Conductivity out of conc. table (62)” alarm
is generated.
Note
If only one point is specified in the table (K
0
, T
0
, C
0
), the concentra-
tion values at a given conductivity do not vary with temperature. If
the conductivity values changes to K
X
, then the concentration C
X
is
calculated as follows:
C
X
= K
X
* (C
0
/K
0
)
CONCENTRATION CURVES
The instrument allows the user to insert up to 4 con-
centration tables, and each table is defined by up to
25 triplets of conductivity (K), temperature (T) and
concentration (C) values.
Note that all conductivity values in this section are actual values (i.e. not com-
pensated for temperature variation).
The user-defined concentration table then allows to calculate the concentration
from conductivity and temperature values, only if the triplets satisfy the following
conditions:
1. The isothermal curves (i.e. conductivity/concentra-
tion curves at the same temperature) must be strictly
monotonous. Otherwise, when the table is se-
lected, the message “The selected curve is not
strictly monotonous!” is displayed.
2. The conductivity values on the same isotherm must
differ at least 10 μS. Otherwise, when the table is
selected, the message “Invalid conductivity mini-
mum distance in the selected curve!” is displayed.
3. Two subsequent isothermal curves must differ at
least 0.5°C. Otherwise, when the table is selected,
the message “Invalid temperature minimum dis-
tance in the selected curve!” is displayed.
4. It is not possible to use an isotherm including only
one triplet (conductivity, temperature, concentra-
tion) equal to (0, T
X
, 0). Otherwise, when the table
is selected, the message “Isotherm with zero-zero
value is present in the selected curve!” is displayed.
All triplets with the same value for temperature, are used to draw a piecewise-
linear isotherm (see diagram on the next page).
The instrument calculates the solution concentration C
X
from the measured con-
ductivity K
X
at the temperature T
X
, by using the following algorithm:
C
X
= C
L
+ (C
U
- C
L
)*(T
X
- T
L
)/(T
U
- T
L
)
where
• C
L
is the concentration corresponding to the conductivity K
L
at the tempera-
ture T
L
, and T
L
is the temperature of the isotherm just below the temperature T
X