3xLOGIC VIGIL Client User Manual
Page 9
3xLOGIC’s
Opens the Site Map window. You can also open this window from the menu by going to
Opens the Server Alarms window. You can also open this window from the menu by going to
Server Alarms.
Opens the Digital Virtual Switch window.
Opens the Settings window. You can also open this window from the menu by going to
Clicking the
button opens the context menu
exported.
Opens the About 3xLOGIC Inc. Client
4.2
Information Bar
The information bar found at the very bottom of the main Client window provides you with the
sent to the Virtual Switch, CPU usage, dat
usage is under 95 percent; red indicates that it is
information screen detailing information about the system, current streams and
4.3
Camera Sidebar
The Sidebar will be discussed in section 6
3xLOGIC’s VIGIL Client - Users Guide Page 9
Doc# 12031914
window. You can also open this window from the menu by going to
window. You can also open this window from the menu by going to
Opens the Digital Virtual Switch window.
window. You can also open this window from the menu by going to
button opens the context menu from which the VIGIL Client settings can be imported or
Inc. Client window that displays the software version.
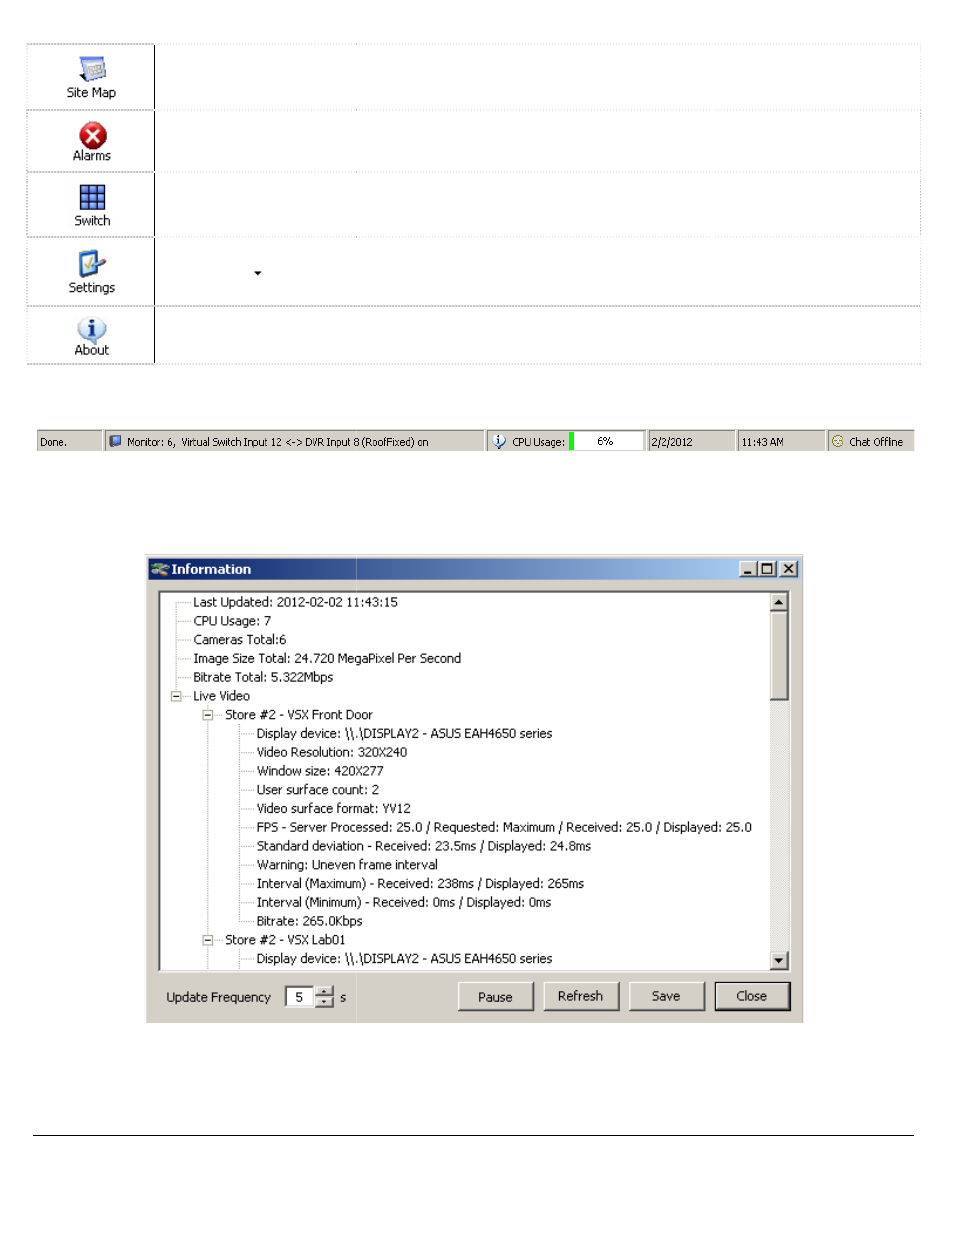
The information bar found at the very bottom of the main Client window provides you with the
CPU usage, date, time, and chat status. A green CPU bar indicates that the CPU
usage is under 95 percent; red indicates that it is over 95 percent, clicking on the CPU Usage will bring up an
information screen detailing information about the system, current streams and virtual switch.
The Sidebar will be discussed in section 6 Camera Sidebar.
window. You can also open this window from the menu by going to View | Site Map.
window. You can also open this window from the menu by going to View |
window. You can also open this window from the menu by going to View | Settings.
Client settings can be imported or
window that displays the software version.
The information bar found at the very bottom of the main Client window provides you with the last command
A green CPU bar indicates that the CPU
over 95 percent, clicking on the CPU Usage will bring up an
virtual switch.