Xover response view – Toa D-901 KR User Manual
Page 48
48
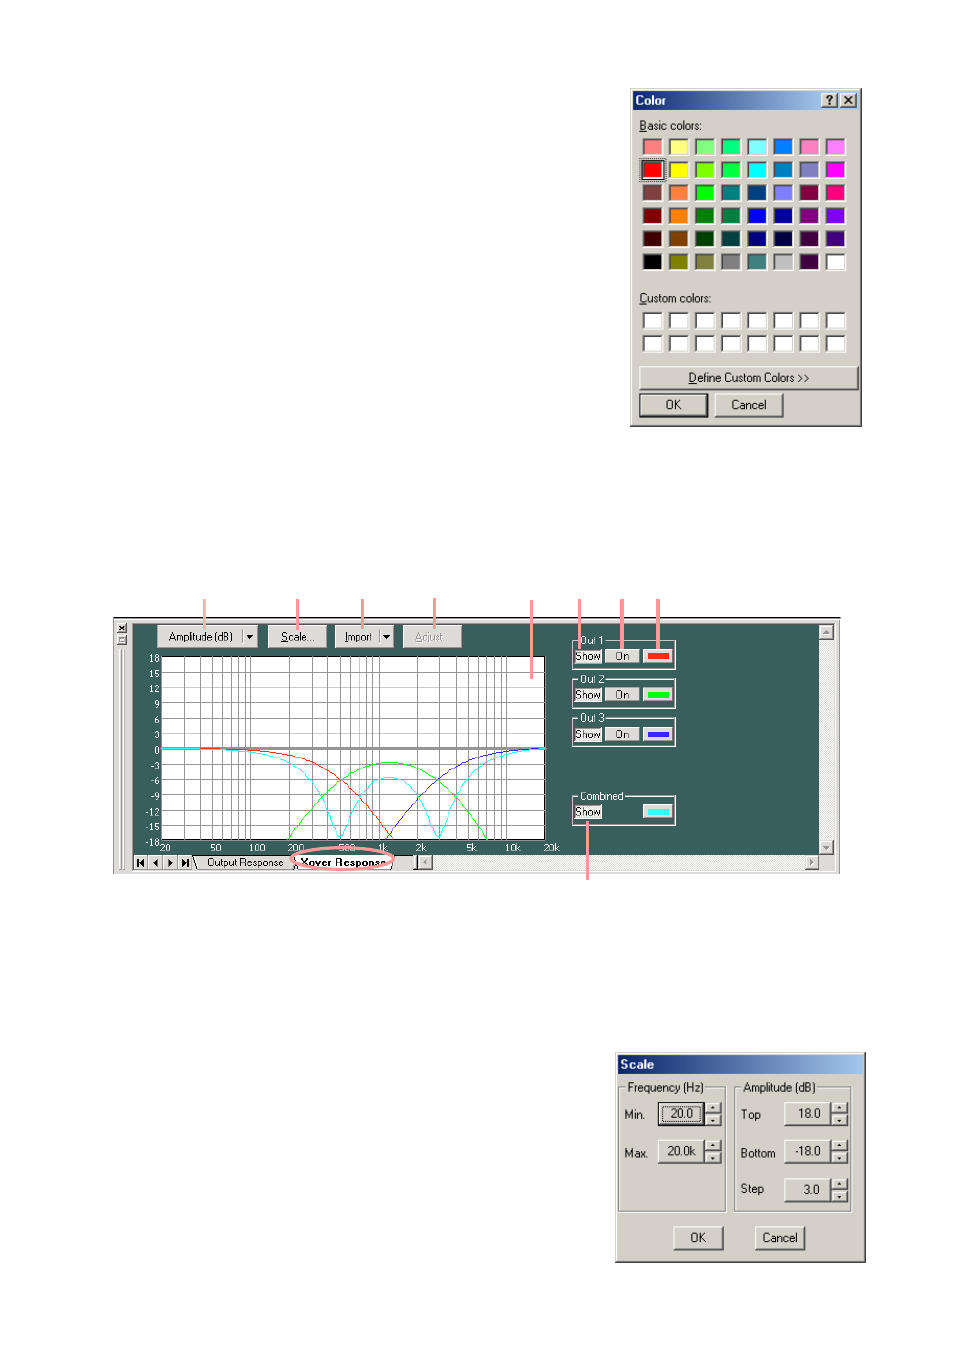
(5) Color change button
If this button is pressed, a dialog for color setting is displayed,
permitting the display colors of response curves of each channel to
be changed.
9.2. Xover Response View
• Displays crossover and filter response curves.
• Displays each channel response, as well as their added overall response.
• Displays the amplitude response, phase response, and group delay response.
(1)
(2)
(3)
(4)
(5)
(6)
(7)
(8)
(9)
(1) Response indication selection button
Displays the types of frequency responses being currently displayed. If this button is pressed, the type of
frequency characteristic to be displayed can be selected from the pull-down menu. There are a full-screen
display that displays any one of amplitude, phase and group delay responses, and a dual-split screen
display that displays two of these 3 characteristics.
(2) Scale change button
Press this button. A dialog for scale setting is then displayed and
the graph scale of the response control can be changed.