Quantitative mode, Enter quantitative mode, 1. standard curve method – LABEC V-18 User Manual
Page 12: Set wavelength
16/18 Manual
9
①
5 groups of test data can display per screen, total 200 groups of data can be saved.
②
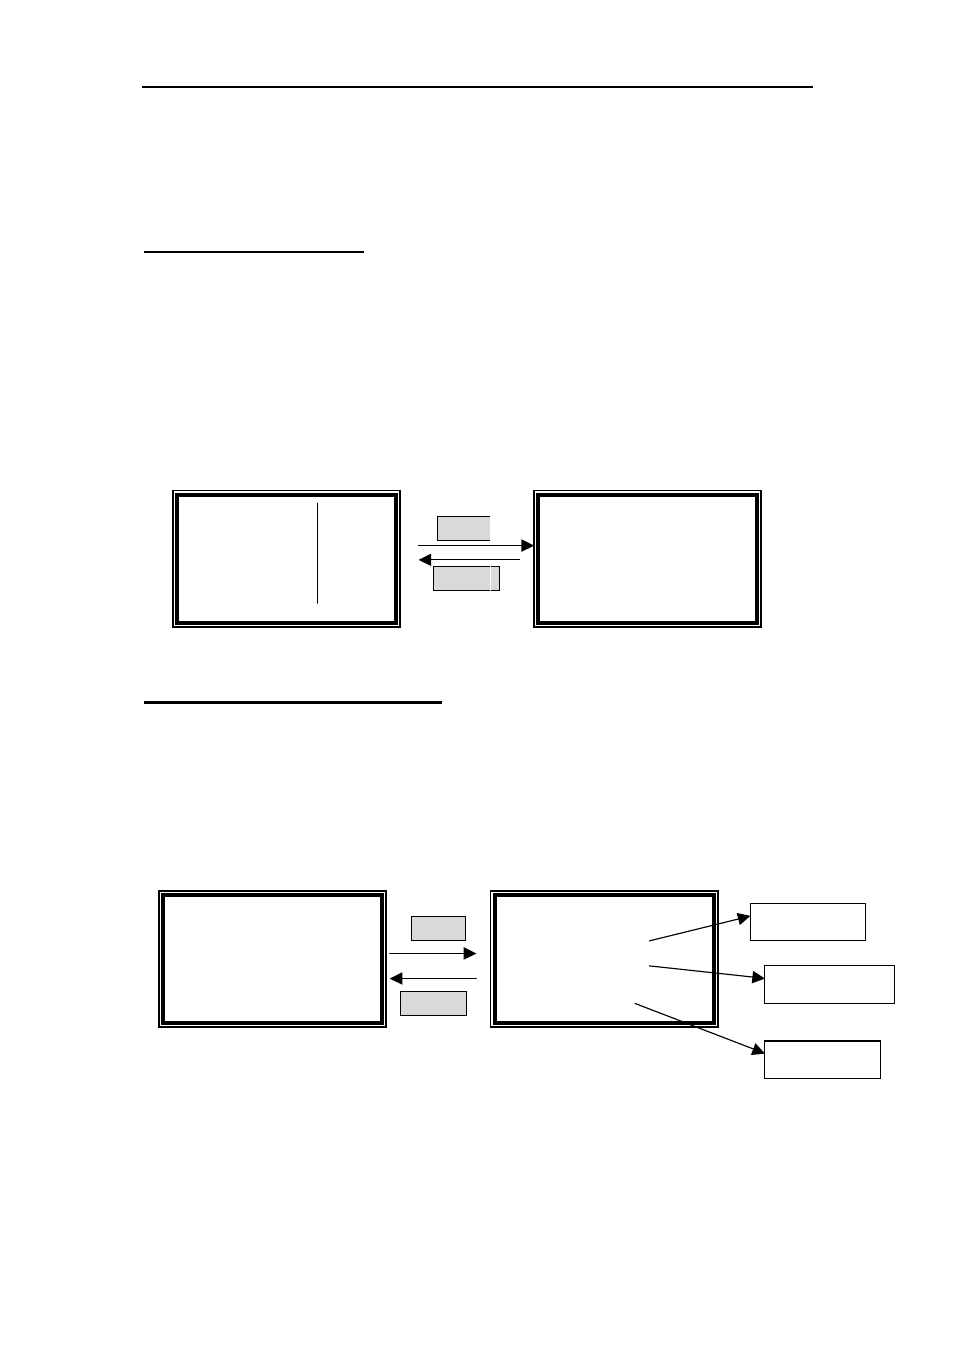
In the right one of Fig. 8, you can change your test wavelength, blank, change test
mode and print by press
【GOTO
GOTO
GOTO
GOTO λ
λ
λ
λ】, 【ZERO
ZERO
ZERO
ZERO】
,
【SET
SET
SET
SET】
and
PRINT】
respectively.
You can also clear the test data by press
【CLEAR
CLEAR
CLEAR
CLEAR】.
2. Quantitative Mode
It includes two test methods, one is Standard curve, the other is Coefficient method. In the
former method, you can establish a standard curve using standard samples known
concentration. If you have known a curve equation, you can select the latter method.
☺ Enter Quantitative Mode
Move the cursor on the
Quantitative Mode,
Press
【ENTER】
to go into the
method choosing interface.(Fig. 9)
ENTER
RETURN
Fig.9
2-1.
Standard Curve Method
It’s a method to establish a standard curve by measuring a group of standard
samples.
Move the cursor on the
Standard Curve
, after
【
ENTER
】
being expressed, it
goes into the pre-testing interface.
(
(
(
(
Fig.10
)
)
)
)
ENTER
RETURN
Fig. 10
☺ Set Wavelength
Press
【 GOTO λ 】
in the pre-testing interface, input the testing
wavelength
by pressing the numeric keypad. (Fig.11). Reference Page
7, you’ll get a detailed instruction.
√
√
√
√Quantitative
●
●
●
●Standard Curve
○
○
○
○Coefficient
○
○
○
○Basic Mode
●
●
●
●Quantitative
○
○
○
○Kinetics 08:00
○
○
○
○Utility 01/01
√
√
√
√Quantitative:
:
:
:
●
●
●
●Standard Curve
○
○
○
○Coefficient
Standard Curve
0.000 Abs
0.000 ml/l
546.0 nm
Current WL.
Current Abs.
Concentration