The main text window – Comtrol eCos User Manual
Page 761
The I/O Auxiliary’s User Interface
The
Preferences
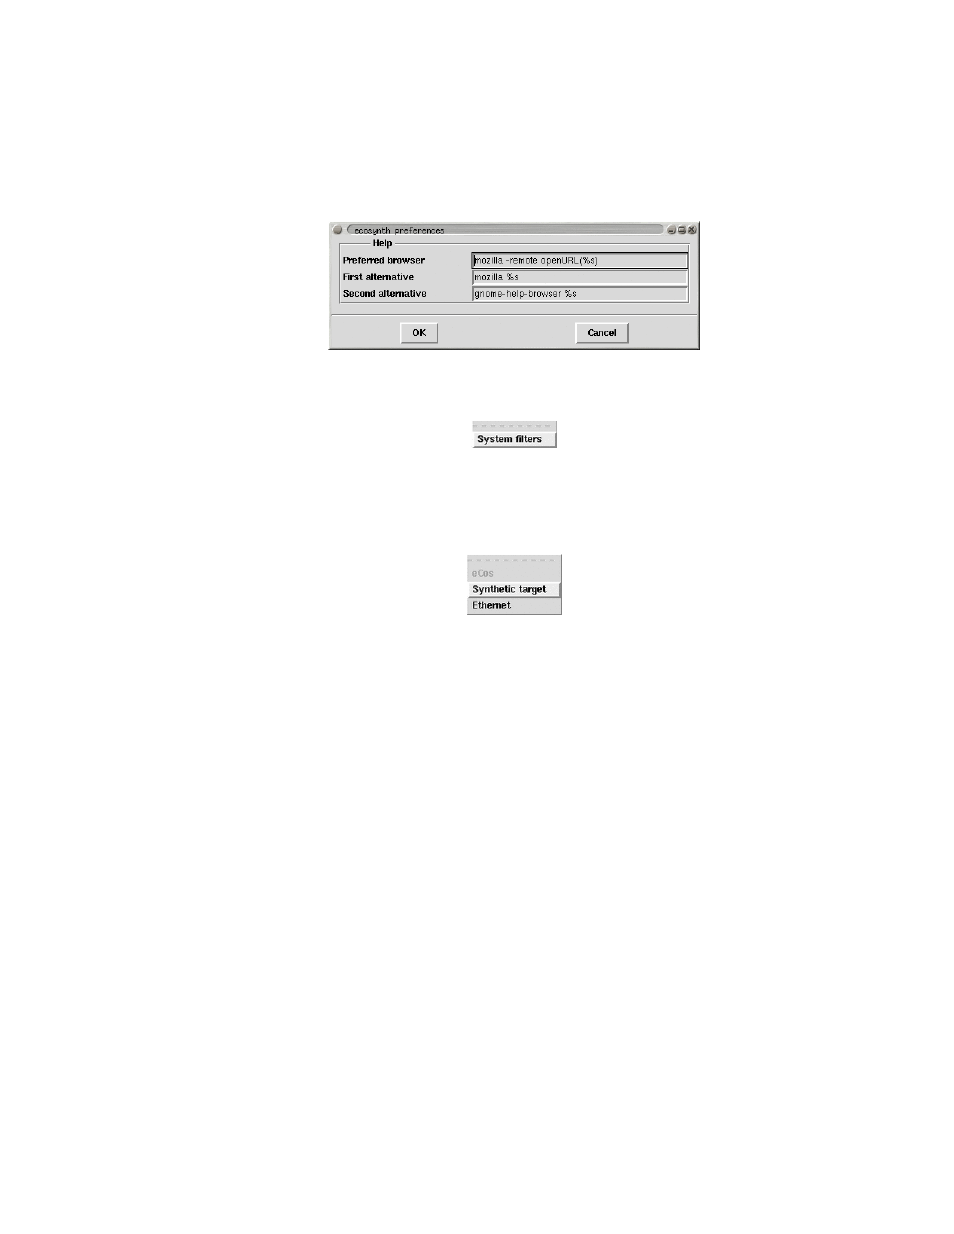
menu item brings up a miscellaneous preferences dialog. One of the preferences relates to online
help: the I/O auxiliary does not currently have a built-in html viewer; instead it will execute an external browser of
some sort. With the example settings shown, the I/O auxiliary will first attempt to interact with an existing mozilla
session. If that fails it will try to run a new mozilla instance, or as a last result use the Gnome help viewer.
The
View
menu contains the
System Filters
entry, used to edit the settings for the current
The
Help
menu can be used to activate online help for eCos generally, for the synthetic target as a whole, and for
specific devices supported by the generic target. The Preferences dialog can be used to select the browser that will
be used.
Note: At the time of writing there is no well-defined toplevel index file for all eCos documentation. Hence the rel-
evant menu item is disabled. Documentation for the synthetic target and the supported devices is stored as part
of the package itself so can usually be found fairly easily. It may be necessary to set the ECOS_REPOSITORY
environment variable.
The Main Text Window
The central text window holds the console output from the eCos application: the screen shot above shows DHCP
initialization data from the TCP/IP stack, and some output from the
main
thread at the bottom. Some devices can
insert text of their own, for example the ethernet device support can be configured to show details of incoming
and outgoing packets. Mixing the output from the eCos application and the various devices can make it easier to
understand the order in which events occur.
The appearance of text from different sources can be controlled by means of filters, and it is also possible to hide
some of the text. For example, if tracing is enabled in the eCos configuration then the trace output can be given
its own colour scheme, making it stand out from the rest of the output. In addition the trace output is generally
voluminous so it can be hidden by default, made visible only to find out more about what was happening when a
particular problem occurred. Similarly the ethernet device support can output details of the various packets being
transferred, and using a different background colour for this output again makes it easier to distinguish from console
output.
657