40
EasyData Guidebook
3.
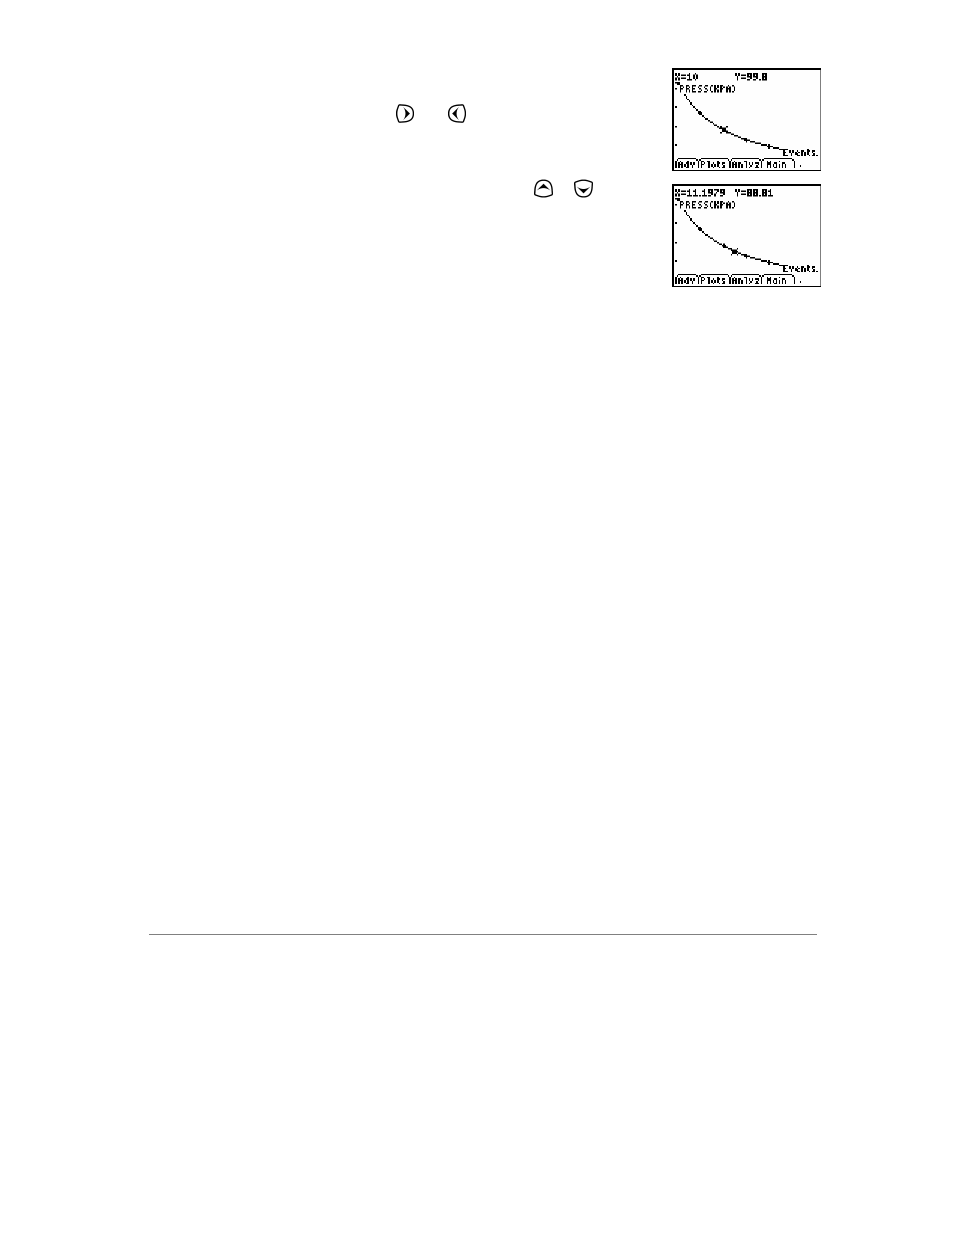
EasyData displays the curve fit drawn over the original
data points. Scroll through the collected data points on
the graph screen using the
and
keys.
To move the trace cursor to the curve fit, press
or
.
The cursor can now be moved along the curve fit.