Curve fits – Vernier EasyData Guidebook User Manual
Page 40
EasyData Guidebook
39
Curve Fits
There are four types of curve fits available in the
menu found on the EasyData
graph screen. Each curve fit is unique and designed for a specific use. When a curve fit is
selected, it will be performed on all of the displayed data. To fit a curve to a specific region
of data, use the Select Region option to isolate only the data you wish to work with. Curve
fits can only be applied to a single data set at a time. For multiple data sets, repeat the
curve fit procedure for each data set being analyzed.
1.
From the EasyData graph screen, select
, and
then choose one of the four displayed curve fits.
Linear Fit – This fit is calculated in the form y = a*x + b.
Values for a, b, and a curve fit correlation R are
calculated and displayed.
Quadratic Fit – This fit is calculated in the form
y = a*x^2 + b*x + c. Values for a, b, and c are calculated
and displayed. A minimum of 3 data points is required.
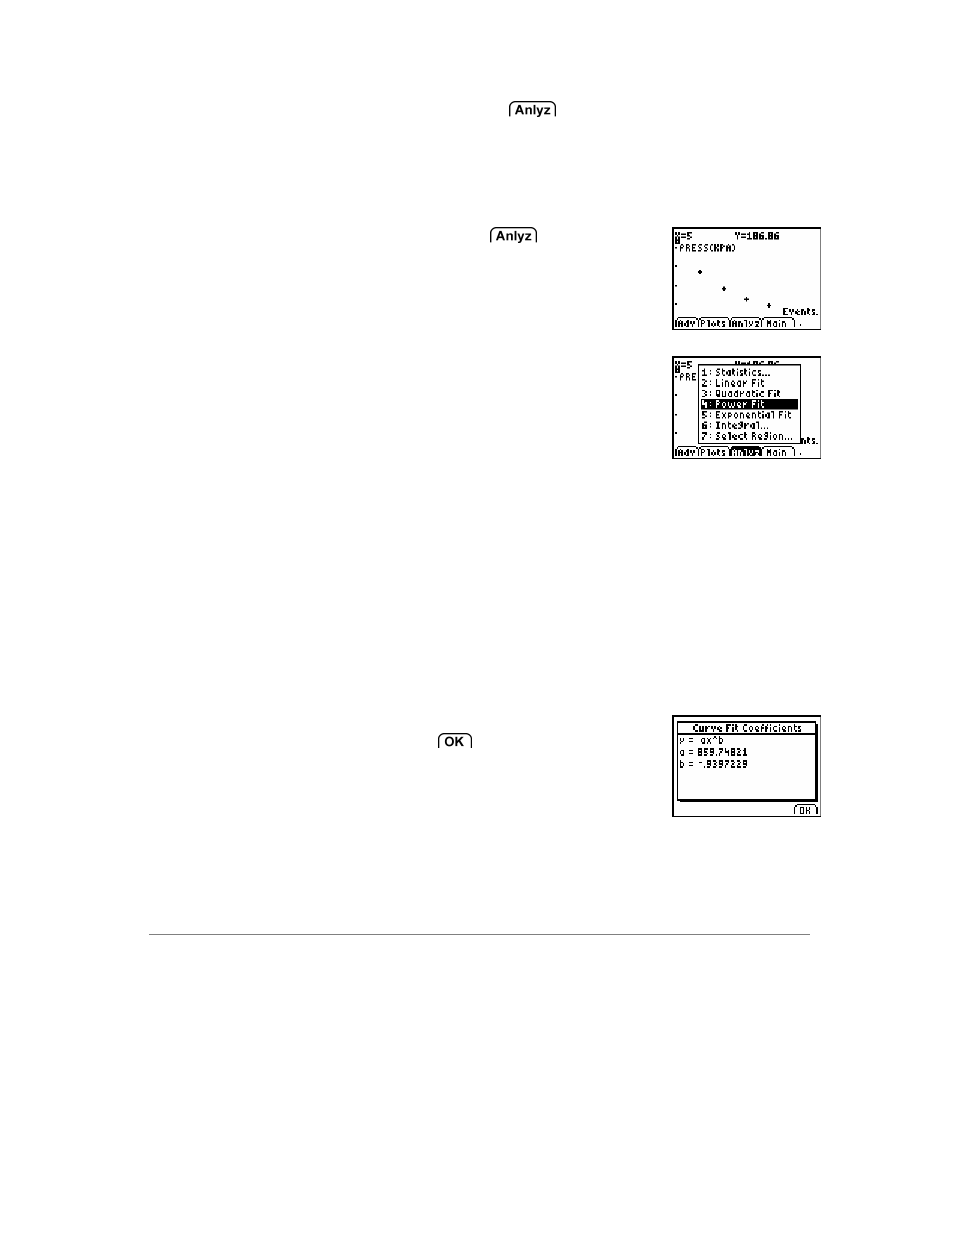
Power Fit – This fit is calculated in the form y = a*x^b.
Values for a and b are calculated and
displayed. A minimum of 2 data points is
required and all data points must be
positive, non-zero values.
Exponential Fit – This fit is calculated in
the form
y = a*e^(-b*x). Values for a and b are
calculated and displayed. A minimum of 2
data points is required and all Y-axis data
must be positive, non-zero values.
2.
The curve fit calculation is performed and the curve-fit
coefficients are displayed. Select
to return to the
graph screen.