Performing statistics or integral calculations – Vernier EasyData Guidebook User Manual
Page 39
38
EasyData Guidebook
Performing Statistics or Integral calculations
Statistics and Integral calculations can be performed over any region of the data shown on
a graph. Statistics and Integral calculations are only allowed on a graph that is displaying a
single dependent variable on the Y-axis. Use the choices from the
and
menus
to display a graph with only a single dependent variable on
the Y-axis.
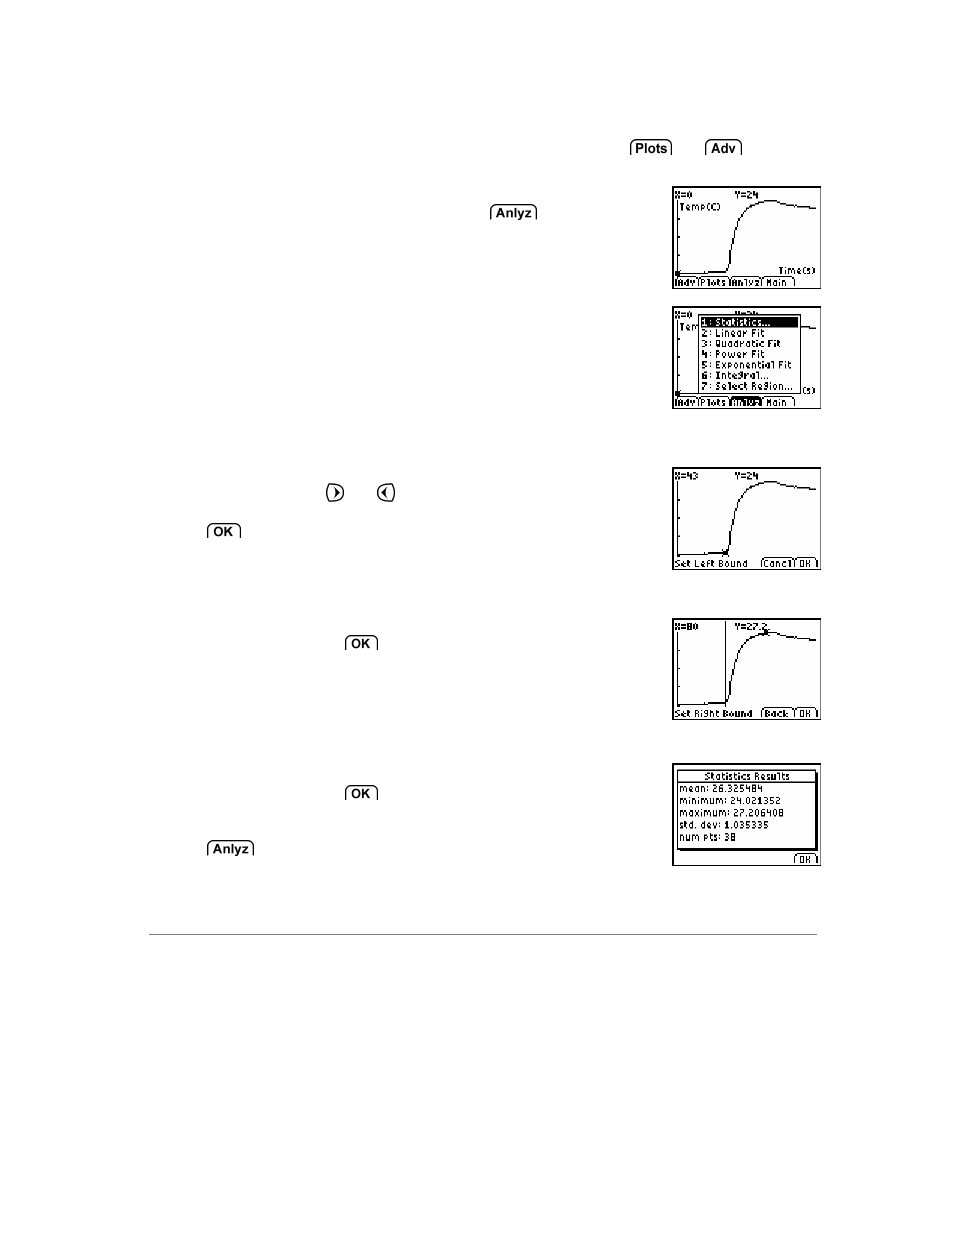
1.
From the EasyData graph screen, select
, and
then choose Statistics.
2.
Scroll through the collected data points on the graph
screen using the
and
keys. Move the cursor to
the left boundary of the data to be analyzed and select
. A vertical line representing the left boundary
marker is displayed.
3.
Move the cursor to the right boundary of the data to be
selected and select
.
4.
A screen is displayed with the results of the statistics
calculations. Select
to return to the graph screen.
To calculate an integral instead of statistics, select
and choose Integral, then repeat Steps 2 – 4.