Vernier EasyData Guidebook User Manual
Page 15
14
EasyData Guidebook
To change Time Graph settings
This example uses a force sensor connected to an EasyLink and a TI-84 Plus
calculator. Your screens will vary depending on which sensor and data-collection
device is attached.
1.
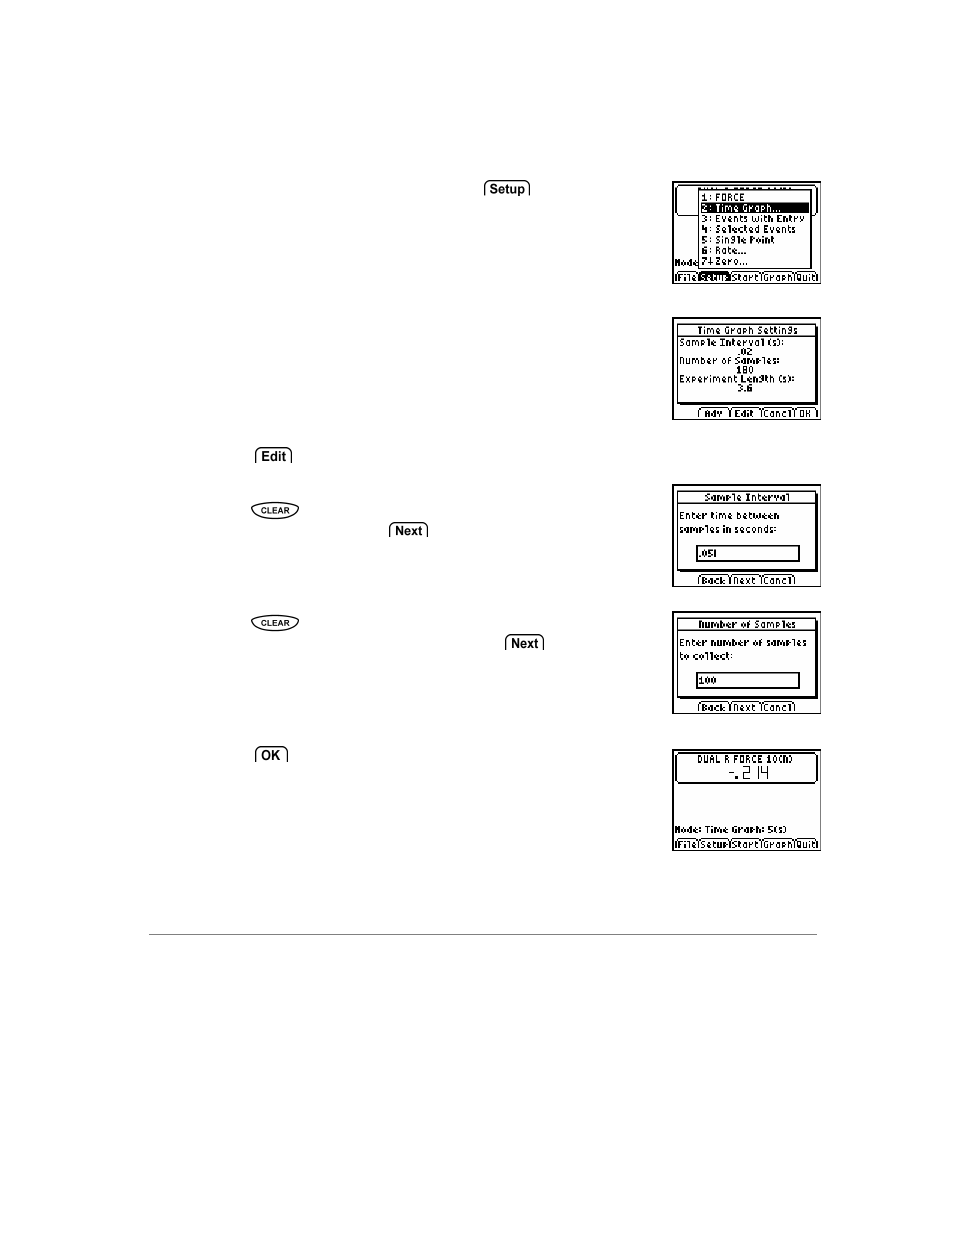
From the EasyData main screen, select
, and
then select Time Graph.. to open the Time Graph
Settings wizard.
The current Time Graph settings are displayed.
2. Select
to enter new Time Graph settings beginning with the sample interval.
Press
to clear the old sample interval and type
in the new interval. Select
to advance to the
number of samples screen.
Press
to clear the old number of samples and
type in the new number of samples. Select
when
finished to display a summary of the new settings.
3. Select
to return to the main screen.