Bio-Rad Experion Protein Analysis Kits User Manual
Page 54
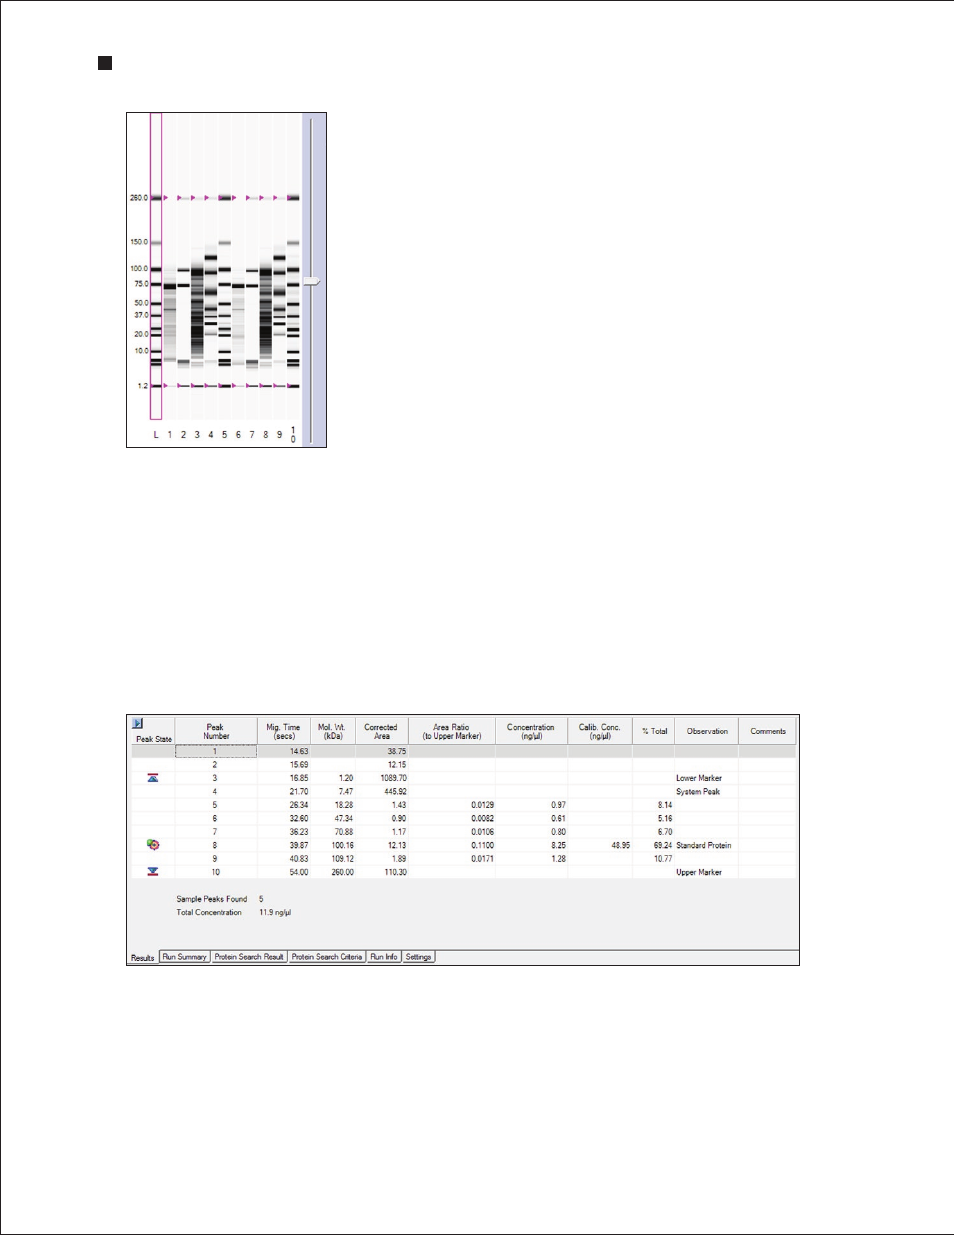
Once separation is complete, the software subtracts background noise, removes spikes, identifies and
integrates peaks, and assigns their sizes and concentrations. The results of data analysis are tabulated
and presented in a Results table at the end of analysis (Figure A.3). The types of data available include
the following:
n
Protein size (or mass, in kD)
n
Protein concentration (in ng/μl): relative concentration under Concentration (ng/µl) and
absolute concentration under Calib . Conc . (ng/ µl)
n
% Total sample (percentage determination)
50
Technical Support: 1-800-4BIORAD • 1-800-424-6723 • www.bio-rad.com
Fig . A .2 . Virtual gel generated by Experion Pro260 analysis . Shown are separations
of the Pro260 ladder (L) and 10 samples on a single chip.
Fig . A .3 . Results table generated by Experion Pro260 analysis .
Upper marker
Lower marker
System peaks
Experion Automated Electrophoresis System