2 changing the fluorescence intensity scale – Bio-Rad Experion Protein Analysis Kits User Manual
Page 28
24
Technical Support: 1-800-4BIORAD • 1-800-424-6723 • www.bio-rad.com
4.2 Changing the Fluorescence Intensity Scale
To display more or less detail in the electropherogram traces and lanes in the virtual gel, use the options
available under the Graph menu, which determine the scale used for the y-axis (fluorescence intensity)
of electropherograms and define the relative scale intensity of the lanes in the virtual gel (Figure 4.10):
n
Scale To Selected — uses the fluorescence value of the tallest peak in a selected
electropherogram to set the scale of the y-axis for all the other samples. Use this option
when comparing (overlaying) a sample with a high-intensity peak and one with a less
intense peak
n
Scale To Global — uses the fluorescence value of the tallest peak from all samples to set
the scale of the y-axis for all the samples. Use this option to adjust the virtual gel to be most
similar to an SDS-PAGE separation
n
Scale To Local (default) — uses the fluorescence value of the tallest peak in each
electropherogram to set the scale of the y-axis for that electropherogram: each sample
is scaled separately. This is the best way to view protein electropherograms and sample
details
n
Scale To Selected Peak — uses the fluorescence value of the selected peak to set the
scale of the y-axis for all samples
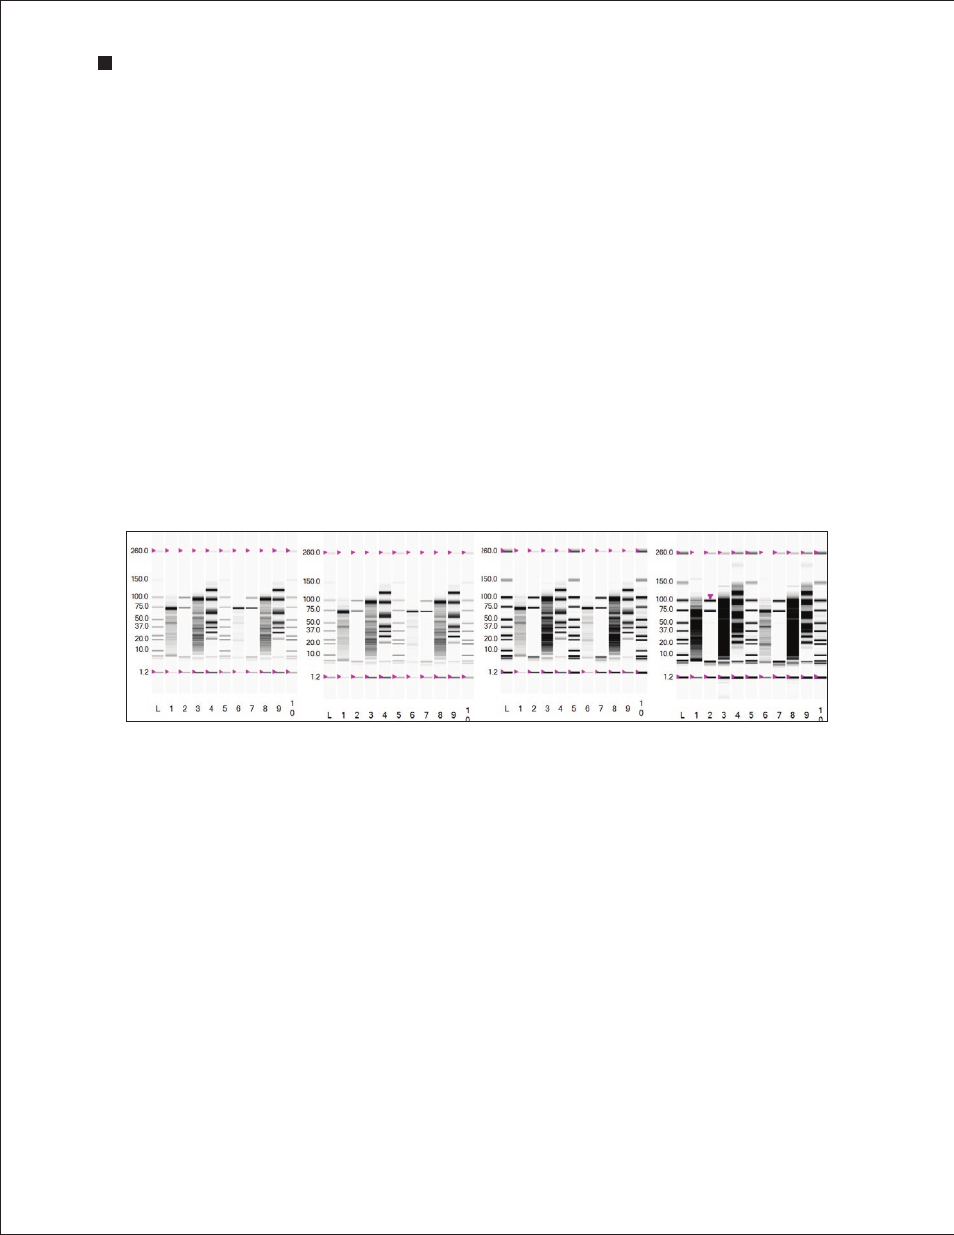
Fig . 4 .10 . Options for modifying the fluorescence intensity scale . Examples of how each option affects the display of a virtual gel are shown.
Scale To Global
Scale To Selected Peak (Lane 11)
Scale To Local
Scale To Selected
Experion Automated Electrophoresis System