4 gel view – Bio-Rad Experion Protein Analysis Kits User Manual
Page 26
Peak Labels
Experion software automatically labels detected peaks with numbers for easy identification, and the
upper and lower markers used for normalization are indicated in green and with an asterisk (*).
To change the type of label displayed, select Graph > Peak Info (or use the pull-down list in the main
screen toolbar) and select one of the following options:
n
No Peak Info — displays no peak information
n
Peak Number — uses sequential numbers for peak identification (default selection)
n
Peak Time — uses peak migration time (min:sec) for peak labels
n
Peak Height — uses peak height in units of fluorescence intensity for peak labels
n
Peak Cor . Area — uses calculated (corrected) peak area for peak labels
n
Molecular Weight — uses calculated mass (molecular weight, kD) for peak labels
n
Peak Concentration — uses calculated relative concentration (ng/μl) for peak labels
Electropherogram Tags (Annotations)
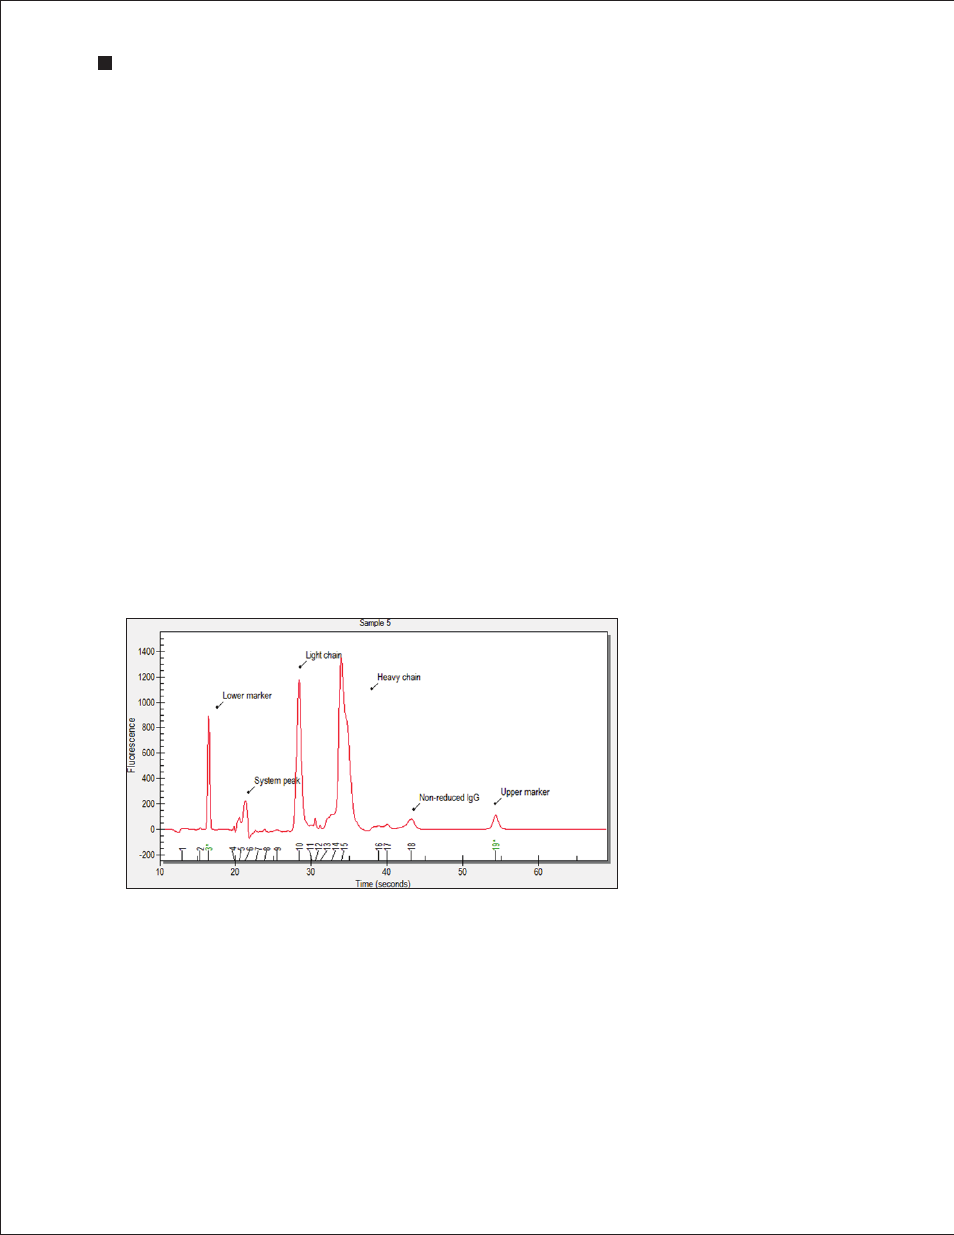
To annotate a peak in the electropherogram, right-click on the peak and select Add Tag (Figure 4.7).
A tag is automatically generated with the peak information selected (for example, peak number).
To edit a tag, right-click on it, select Edit Tag, and change the information. Click OK .
To annotate a region in the electropherogram, right-click in the region and select Add Tag. In the
Edit Tag dialog, enter the annotation and click OK .
To move a tag, click and drag the label to the desired place in the electropherogram.
22
Technical Support: 1-800-4BIORAD • 1-800-424-6723 • www.bio-rad.com
Experion Automated Electrophoresis System
Fig . 4 .7 . Example of tagged
(annotated) peaks in an
electropherogram .