Input connections – channel 1, Input connections – channel 2, External battery switch – NOVUS LogBox-DA User Manual
Page 5: Installation recommendations, Offloading and data visualization, Transfering records, Visualizing the data, Graph window

LogBox-DA
NOVUS AUTOMATION
5/7
INPUT CONNECTIONS – CHANNEL 1
The following figures show connections for the various input types
accepted in channel 1. No jumper is required to adjust the channel 1
input type (the circuit is reconfigured automatically according to the
input type selected).
INPUT CONNECTIONS – CHANNEL 2
For adequate use of channel 2, set internal J1 and J2 positioning
according to the input signal chosen, as shown in the table below
(factory default is 4-20mA / 0-20mA signals).
Input signal
J1 Position
J2 Position
4-20 mA / 0-20 mA
A
A
0-10V
B
B
0-50 mV
C
C
Table 1 – J1 and J2 positioning
The following figures show connections for different types of signals
applied to channel 2.
EXTERNAL BATTERY SWITCH
The example below shows the usage of the external battery switch
for commanding the power supply of external devices.
- Channel 2 is configured to 4-20mA input signal. A battery is used to
provide power to the 4-20 mA loop. The battery switch “turns on” the
power to the loop a moment (defined in the configuration) before the
measurement is taken, enabling the transmitter (pressure,
temperature, etc) to start up and stabilize the output. This approach
saves the battery energy, as the power is turned on only when
required (before each measurement).
Fig. 13 – Example of the battery switch powering a transmitter.
INSTALLATION RECOMMENDATIONS
•
Signal wires should be installed in grounded conduits and away
from power or contactor wires.
•
Installing RC filters (47Ω and 100nF, serial) is strongly
recommended at contactor coils or any other inductors.
•
System failure should always be taken into account when
designing a control panel to avoid irreversible damage to
equipment or people.
OFFLOADING AND DATA VISUALIZATION
TRANSFERING RECORDS
Transferring the data to a PC is accomplished by clicking on the
button
in the LogChart II software. The IR wand must be pointed
to the logger during the process. Data can be collected anytime and
saved in files for future analysis (menu “File Save” or “File Save as”).
While in offloading process, a progress bar is displayed. The offload
time is proportional to the amount of data being transferred (number
of records in memory).
After data transfer is completed, the Graph window is displayed.
NOTE
: The logging is not stopped during the data offload process.
The LogChart-II software includes a help section with detailed usage
information.
VISUALIZING THE DATA
Three views are provided for data visualization. The records can be
analyzed in the form of Chart (graph) or Table. A third window, called
General Information window (Fig. 15), shows acquisition details
and logger configuration.
A region of interest in the data can be selected (see item
Gr
aph
Window, below). The Graph Window can be printed and the
corresponding data exported as text files to other applications, such
as spread sheets.
The same windows are created when the data is read from a
previously saved file.
After the windows are opened, one can save the data to a file (.lch),
print graphs, or export the data from the General Information and
Acquisitions Table windows to a text file (.txt or .dat).
Graph window
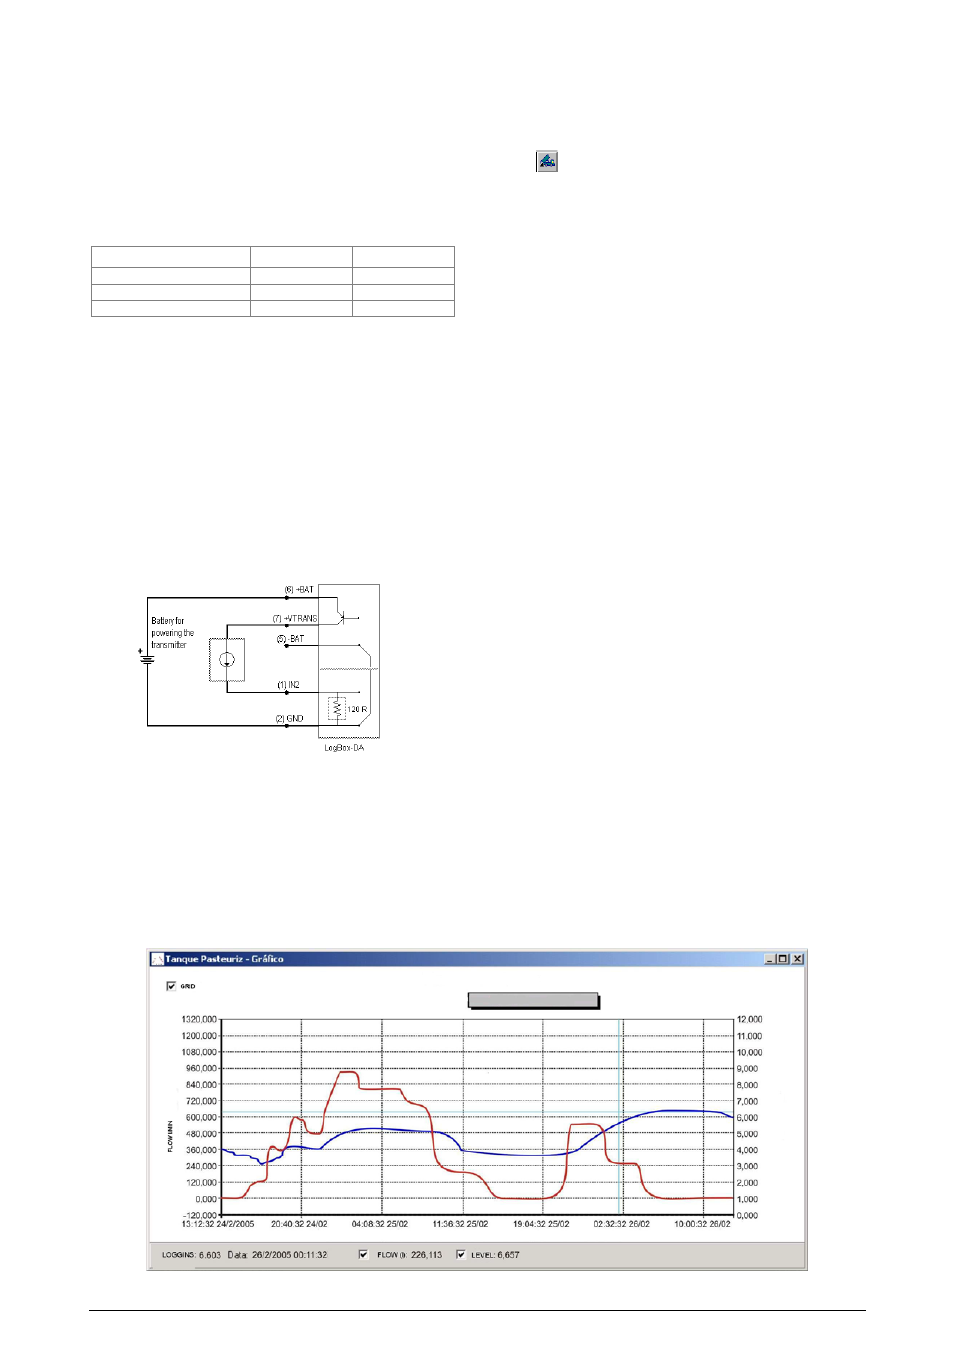
The Graph is a convenient tool for analysis. As one moves the
mouse in the chart area, the time and the value of the records of
each channel are shown in the field located in the bottom of the
window.
Zooming in and out are implemented. They are available in the menu
“View” or in the tool bar as icons. It is possible to select an area by
clicking and dragging the mouse, creating this way a zoom region,
starting at the upper left position of the region of interest.
The graphs can be moved vertically by moving the mouse up or
down while keeping the mouse right button pressed.
Fig. 14 shows the Graph window.
The Graph window is automatically opened after the offload process.
The two other windows (Table and General Information) can be
opened accessing the menu or clicking on the corresponding button.
Fig. 14 – Screenshot showing the graphic visualization of logged data
