Table 10 – Campbell Scientific TGA100 Trace Gas Analyzer Manual User Manual
Page 56
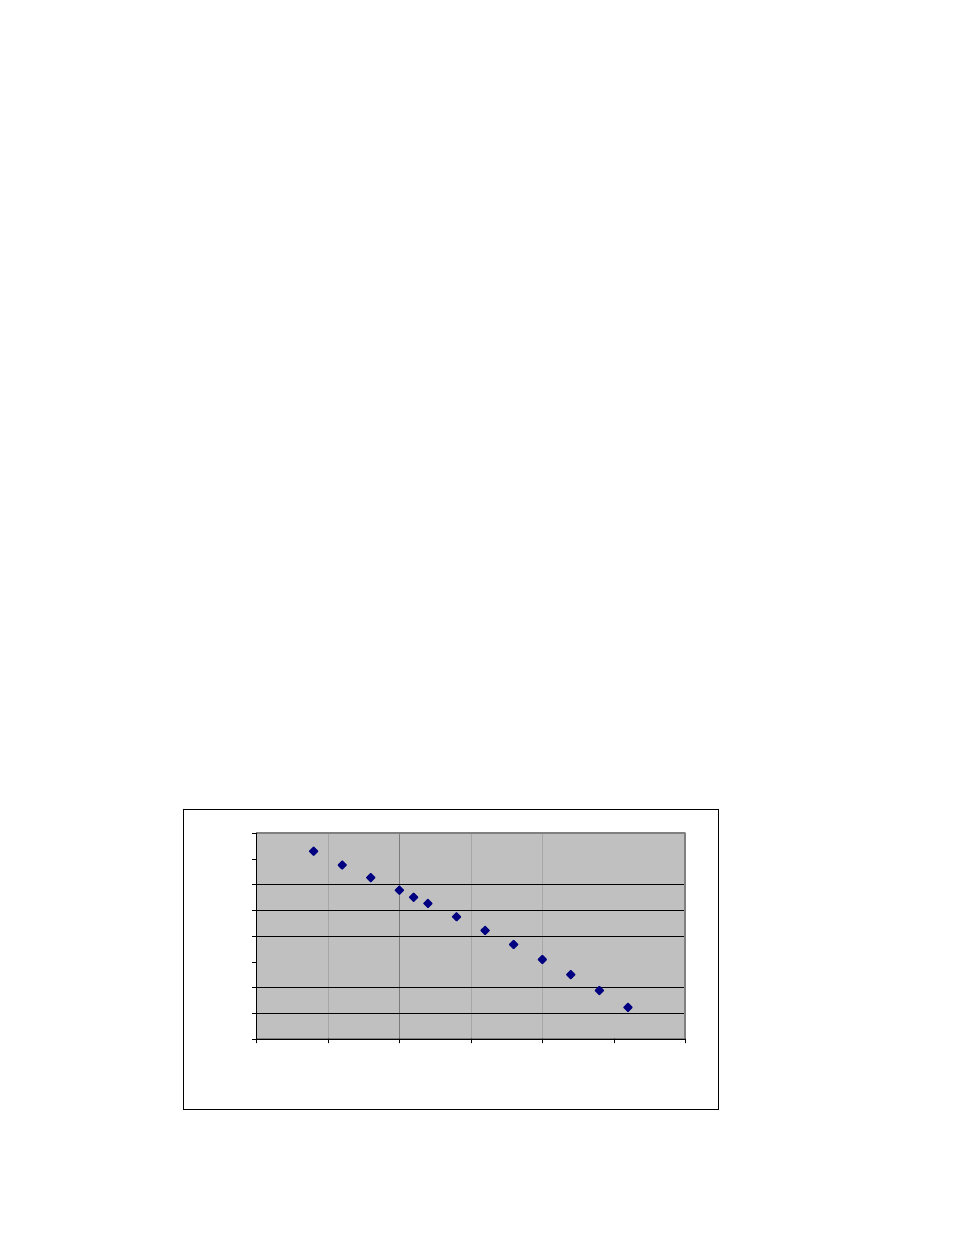
Table 10. Example Laser Temperature Optimization Data
Laser
Temperature (K)
Laser DC
Current (mA)
Reference
Transmittance (%)
Concentration
Noise (ppb)
Sample Signal
(mV)
103.7
482.6
65.9
7
30
103.9
477.4
66.2
8
27.6
104.1
472.1
66.4
9
24.9
104.3
466.6
67.3
10
21.9
104.5
460.8
69.1
13
18.3
104.7
454.9
72
20
14.4
104.9
448.7
78.2
45
10
105.1
442.2
90.5
350
4.9
Transmittance and noise much worse - try going down.
103.5
487.7
65.8
7
32.5
103.3
492.6
67.7
6
34.5
103.1
497.5
77.8
15
36.3
102.9
502.9
89.5
85
38.7
Transmittance and noise worse again - go to optimum temperature.
103.6
485
65.5
6
31
Increase the laser operating temperature by 0.1 or 0.2 K. Some lasers will allow a larger temperature increment, but
when in doubt, use 0.1 K. The line locking algorithm will decrease the DC current as needed to keep the absorption line
in the center of the ramp. Wait until the laser temperature and DC current stabilize, and record the values. Iterate this
process until the transmittance or concentration noise increases noticeably. Return to the starting laser temperature, and
then step the temperature downward, again noting the laser temperature, DC current, reference transmittance,
concentration noise, and sample signal at each step, until the transmittance or concentration noise again increases
noticeably.
To evaluate the results, first verify the DC current decreases approximately linearly with increasing temperature. A
discontinuity indicates the line locking algorithm may have switched to a different absorption line. This can be caused
by other strong absorption lines nearby, or by a laser mode hop. If this happens, repeat parts of this test near the
discontinuity, using a smaller step in laser temperature, and watching the reference detector transmittance carefully. If
the discontinuity was caused by another strong absorption line near by, using a smaller temperature step may solve the
problem. If the discontinuity was caused by a mode hop, this is the end of the temperature tuning range for the selected
absorption line. It is generally not necessary to actually plot the data, but
shows a graph of a typical data set
where the same absorption line is scanned with a range of temperatures.
Figure 4-6. Typical Laser DC Current as a Function of Temperature
430
440
450
460
470
480
490
500
510
102.5
103
103.5
104
104.5
105
105.5
LaserTemperature (K)
Laser DC Current (mA)
56