Figure 9, Figure 10 – Vaisala DM500 User Manual
Page 31
Chapter 4 _________________________________ General Information About Sampling and Results
VAISALA _______________________________________________________________________ 29
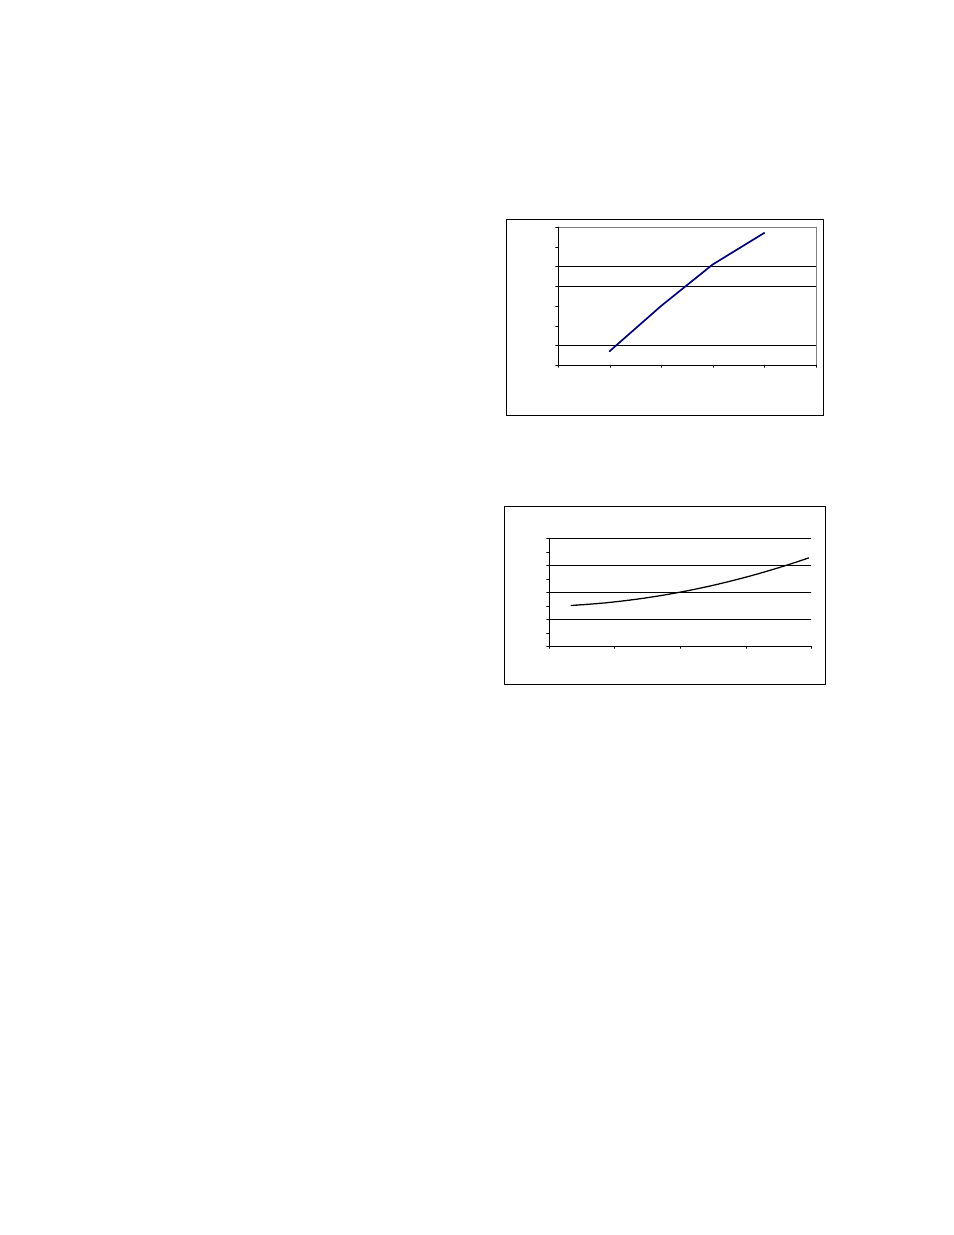
The Effect of the Sample Gas Flow Rate on
Cooling Capacity and Result Deviation
The cooling effect of the gas flow rate is
shown in
Figure 9
(on the right). Low flow
rate increases cooling capacity but also
increases response time.
-79
-78
-77
-76
-75
-74
-73
-72
0
0.5
1
1.5
2
2.5
Flow l/min
Tsensor /C
Figure 9
Effect of Sample Flow Rate on Lowest
Achievable Sensor Temperature
The sample flow rate has an effect on the
deviation of the measurement results as
shown in
Figure 10
(on the right).
Sample flow rate range: 0.5...1.5 slpm.
Recommended sample flow rate: 1.0 slpm.
-0.2
-0.15
-0.1
-0.05
0
0.05
0.1
0.15
0.2
0.5
0.75
1
1.25
1.5
flow/slpm
devi
ati
on/
°C
Figure 10
Effect of Sample Flow Rate on
Dewpoint Measurement at -60 ºC