Understanding the performance statistics – HP StoreVirtual 4000 Storage User Manual
Page 222
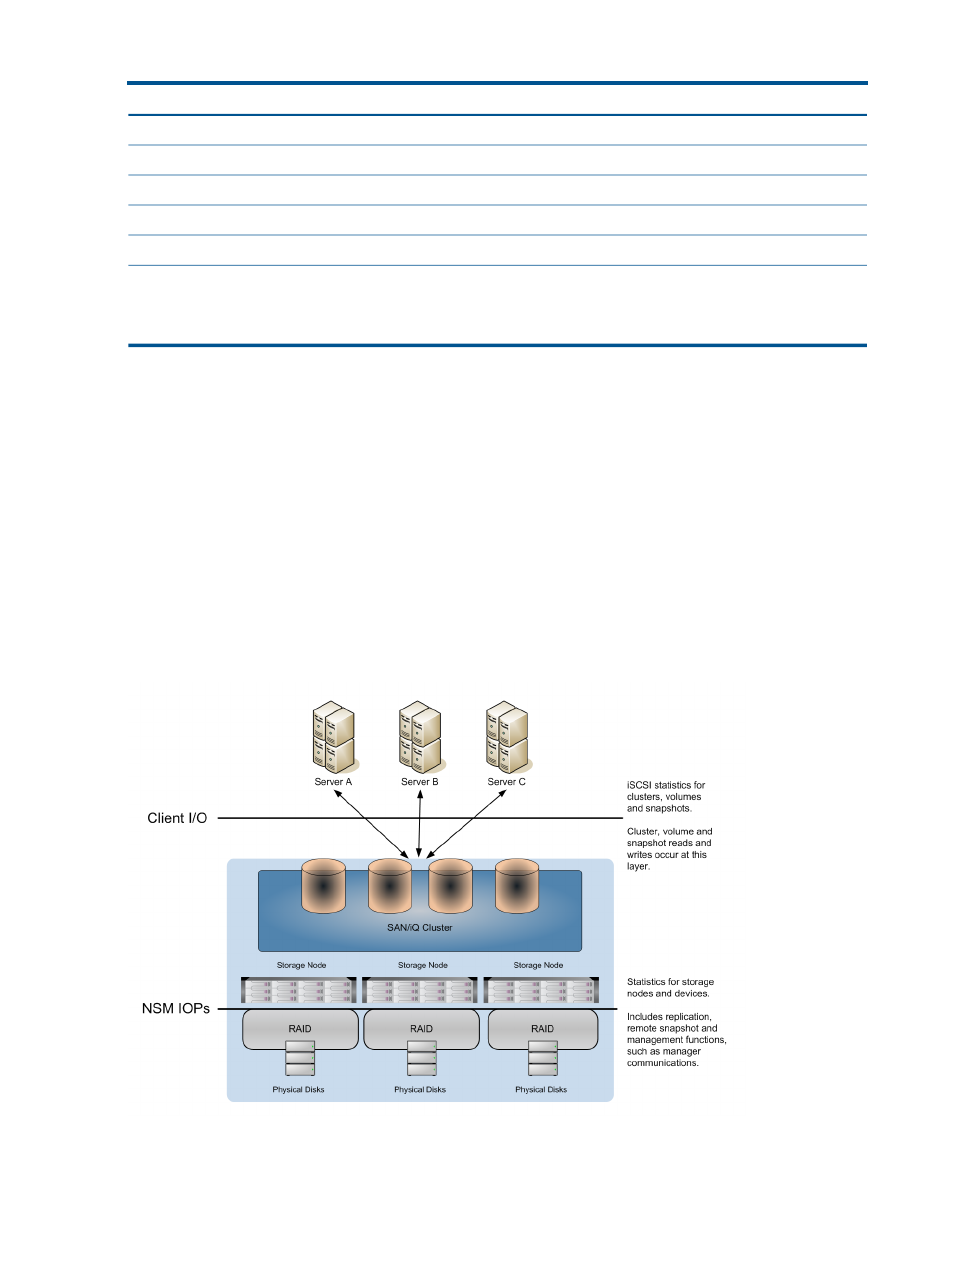
Table 69 Performance Monitor table columns (continued)
Definition
Column
Unit of measure for the statistic.
Units
Current sample value for the statistic.
Value
Lowest recorded sample value of the last 100 samples.
Minimum
Highest recorded sample value of the last 100 samples.
Maximum
Average of the last 100 recorded sample values.
Average
Scaling factor used to fit the data on the graph’s 0 to 100
scale. Only the line on the graph is scaled; the values in
Scale
the table are not scaled. The values in the log file, if you
export the file, are also not scaled.
For information about adding statistics, see
“Adding statistics” (page 225)
.
Understanding the performance statistics
You can select the performance statistics that you want to monitor.
For clusters, volumes, and snapshots, the statistics being reported are based on client IO. This is
the iSCSI traffic and does not include other traffic such as replication, remote snapshots, and
management functions.
For storage systems and devices, the statistics report the total traffic, including iSCSI traffic along
with replication, remote snapshots, and management functions.
The difference between what the cluster, volumes, and snapshots are reporting and what the storage
systems and devices are reporting is the overhead (replication, remote snapshots, and management
functions).
Figure 106 Performance statistics and where they are measured
The following statistics are available:
222 Monitoring performance